Rotation
Where money moved
Track A · pricesPrices through Nov 19. Leading 4 · improving 3 · weakening 3 · lagging 1. Moved this week: XLB leading → improving.
| Sector | Quadrant | 1M abs | 1M vs SPY | 3M abs | 3M vs SPY | 6M abs | 6M vs SPY | Change (1M rel − 3M rel) | Trend | Breadth (sampled top holdings) | Narrative |
|---|---|---|---|---|---|---|---|---|---|---|---|
| XLU Utilities | LEADING | +2.4% | +10.6% | +1.3% | +8.1% | -3.9% | -0.4% | +2.5% | mixed | 7/10 | -1 |
| XLY Discretionary | LEADING | +0.3% | +8.3% | -1.6% | +5.0% | -2.4% | +1.2% | +3.3% | above both | 9/10 | +0 |
| XLF Financials | LEADING | -0.8% | +7.1% | -3.0% | +3.5% | +7.8% | +11.7% | +3.6% | mixed | 4/10 | +2 |
| XLRE Real estate | LEADING | +1.9% | +10.1% | -4.1% | +2.3% | -2.1% | +1.4% | +7.8% | mixed | 6/10 | -2 |
| XLB Materials | IMPROVING (was leading a week ago) | -3.7% | +4.0% | -7.3% | -1.1% | -0.9% | +2.7% | +5.1% | below both | 7/10 | +0 |
| XLC Communications | IMPROVING | -5.7% | +1.8% | -7.5% | -1.3% | -10.5% | -7.2% | +3.1% | below both | 3/8 | -2 |
| XLI Industrials | IMPROVING | -4.1% | +3.5% | -10.2% | -4.2% | -5.6% | -2.1% | +7.8% | below both | 2/10 | -2 |
| XLP Staples | WEAKENING | +3.2% | +11.4% | +5.2% | +12.2% | +7.4% | +11.3% | -0.8% | above both | 9/10 | +2 |
| XLV Health care | WEAKENING | -0.8% | +7.1% | +2.0% | +8.8% | +19.4% | +23.7% | -1.7% | above both | 7/10 | +4 |
| XLE Energy | WEAKENING | -10.7% | -3.5% | -3.8% | +2.7% | +3.7% | +7.5% | -6.2% | mixed | 9/10 | +3 |
| XLK Technology | LAGGING | -14.8% | -8.0% | -12.2% | -6.4% | -10.7% | -7.5% | -1.6% | below both | 4/10 | -4 |
Versus SPY is relative wealth return: (sector total return) / (SPY total return) − 1, in percent — not a percentage-point difference of the two returns. Absolute columns are the sector's own total return over the same window. Change is 1-month relative return minus 3-month relative return; it is not a measured weekly change. Quadrant: level = 3-month relative wealth vs SPY, change = 1M rel − 3M rel. Leading = ahead and gaining, weakening = ahead but losing ground, improving = behind but gaining, lagging = behind and losing ground. Trend compares the last close with the 50- and 200-day averages. Breadth = how many of the ETF's sampled top holdings beat SPY over 3 months (numerator/denominator of names with a 3-month relative; holdings lists as of 2026-07-20 to 2026-08-23; missing constituents are omitted, not assumed to have beaten SPY). Narrative = Track B score, shown only when a validated observation is current. Existing research rules are unchanged.
What the narrative says
Track B · Grok on XPost-hot-CPI environment with rising hike odds and yields near 5%; clear narrative of rotation out of tech/growth/AI into defensives (healthcare/staples) and select cyclicals (energy/financials), though pure positioning claims remain sparse vs price/RS chatter.
| Sector | Score | Δ vs prior valid | Conf. | Evidence | Price 3M |
|---|---|---|---|---|---|
| XLV | +4 | +1 | 0.8 | narrative | agrees |
| XLE | +3 | +7 | 0.7 | positioning | agrees |
| XLF | +2 | +4 | 0.55 | narrative | agrees |
| XLP | +2 | +4 | 0.65 | narrative | agrees |
| XLY | +0 | -2 | 0.4 | narrative | — |
| XLB | +0 | -1 | 0.4 | narrative | — |
| XLU | -1 | +0 | 0.45 | narrative | disagrees |
| XLI | -2 | -5 | 0.5 | narrative | agrees |
| XLRE | -2 | -1 | 0.55 | narrative | disagrees |
| XLC | -2 | -2 | 0.5 | narrative | agrees |
| XLK | -4 | -5 | 0.75 | positioning | agrees |
Scores run −5 (crowded bearish narrative) to +5 (crowded bullish), are forced to sum to about zero across the 11 sectors, and come from Grok reading recent X posts. Δ compares with the prior validated observation (ADJ-2026-11-09). "Price 3M" says whether the narrative sign matches the measured 3-month relative. Each sector card below lists the narrative themes and the strongest contrary evidence.
Rejected observations are kept on disk but never shown. Recent rejections: ADJ-2026-10-11 (score sum +4); ADJ-2026-10-18 (score sum +5); ADJ-2026-11-01 (score sum +4). Every rejection so far failed only the zero-sum check.
Charts & decisions
Sectors, then leadersOne card per sector ETF (in quadrant order), then the strongest top holding of each sector. TAKE / PASS / DEFER records what you would do; it places nothing. Submit at the bottom seals every call into one block to paste into chat.
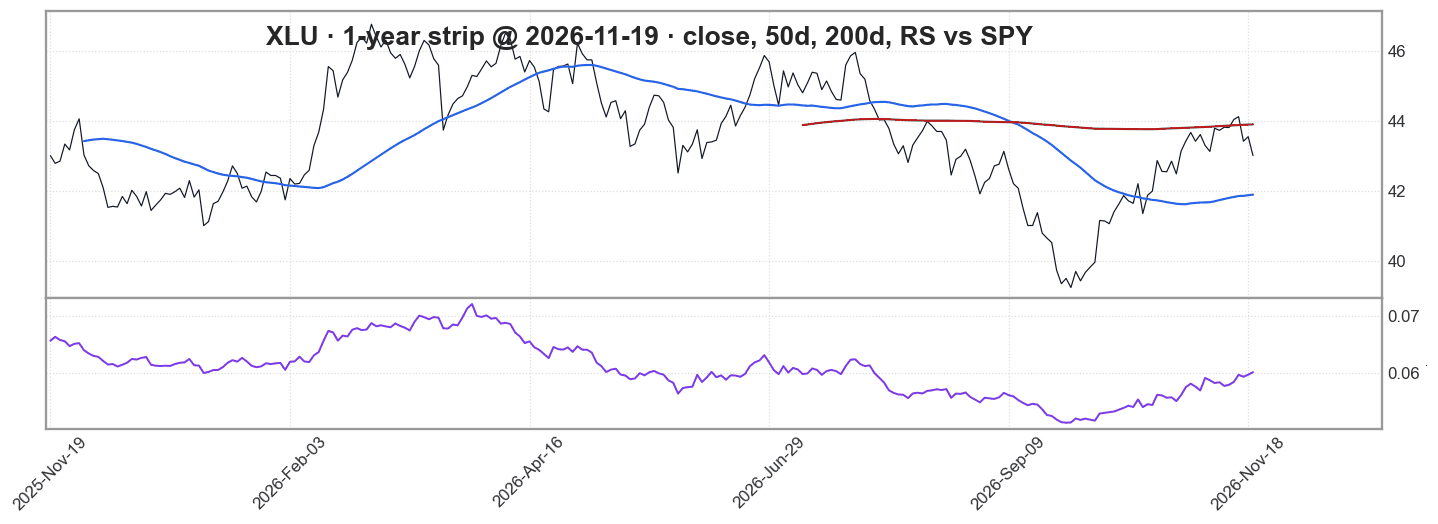
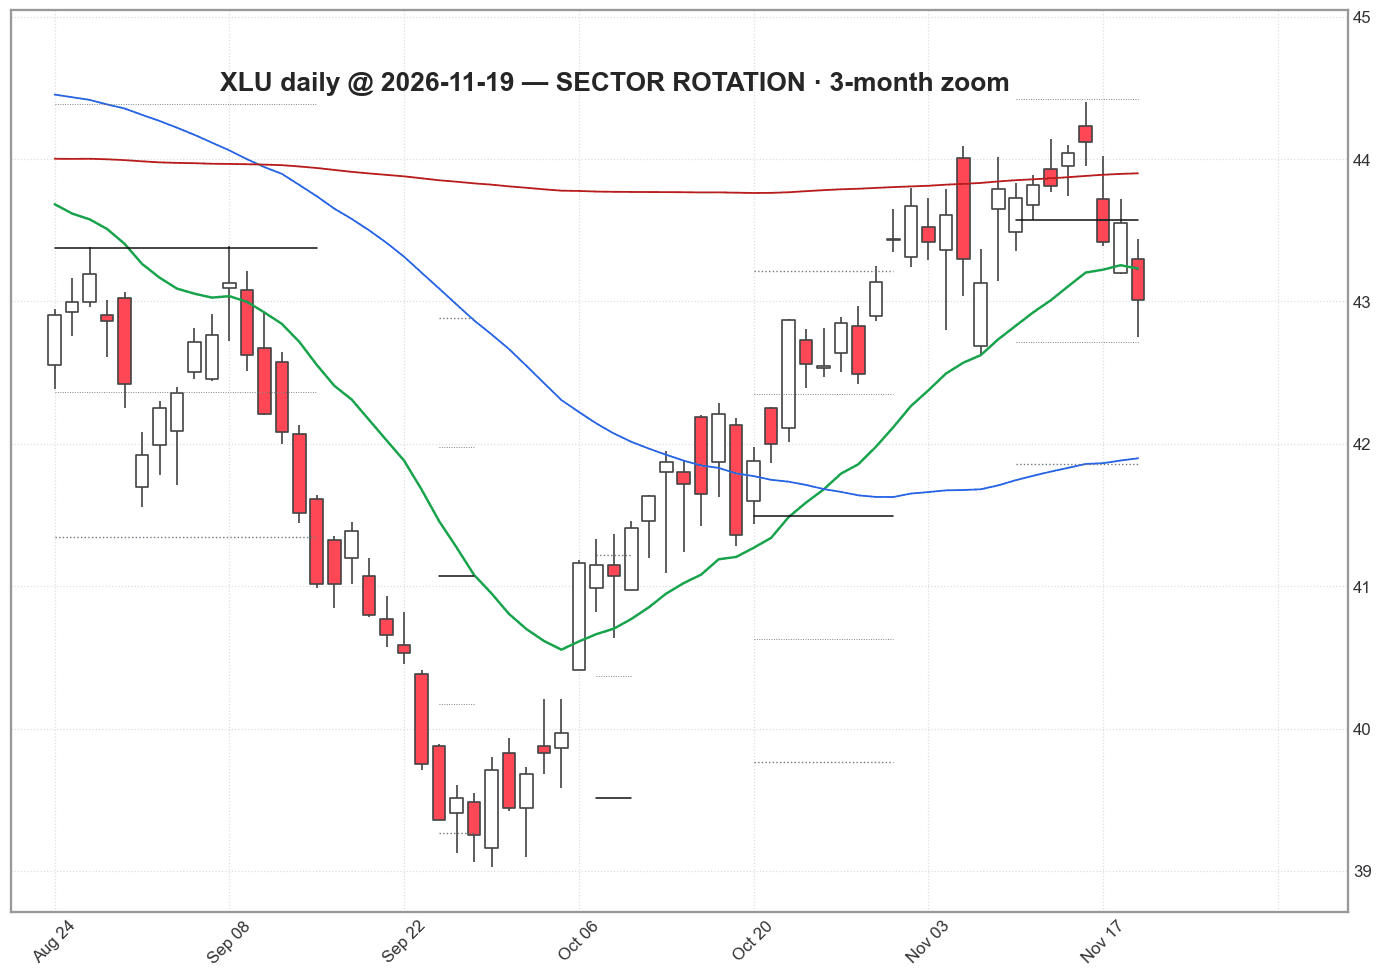
XLU · Utilities · LEADING · 3M vs SPY +8.1%
price trend: strongPrices 2026-11-19Utilities is leading: ahead of SPY over 3 months and still gaining. Versus SPY: +10.6% over 1 month, +8.1% over 3 months, -0.4% over 6 months. Price is mixed of its 50- and 200-day averages. Narrative score -1 (confidence 0.45): Basing stage but lagging RS rankings and mild red closes on yield spike (flow_analyst); Utilities not participating in defensive bid as much as staples/healthcare (retail). Against: Stage analysis lists utilities in basing leaders group with potential for rotation catch-up. Descriptive only; not a forecast. Source: Track A: Robinhood daily bars (Yahoo backup) through 2026-11-19; Track B: ADJ-2026-11-10 (validated)
| Quadrant | LEADING |
|---|---|
| A week ago | LEADING |
| 1M vs SPY | +10.6% |
| 3M vs SPY | +8.1% |
| 6M vs SPY | -0.4% |
| Change (1M−3M) | +2.5% |
| Breadth (top 10 beating SPY, 3M) | 7/10 |
| Narrative score | -1 |
| 20-day vol (ann.) | 13% |
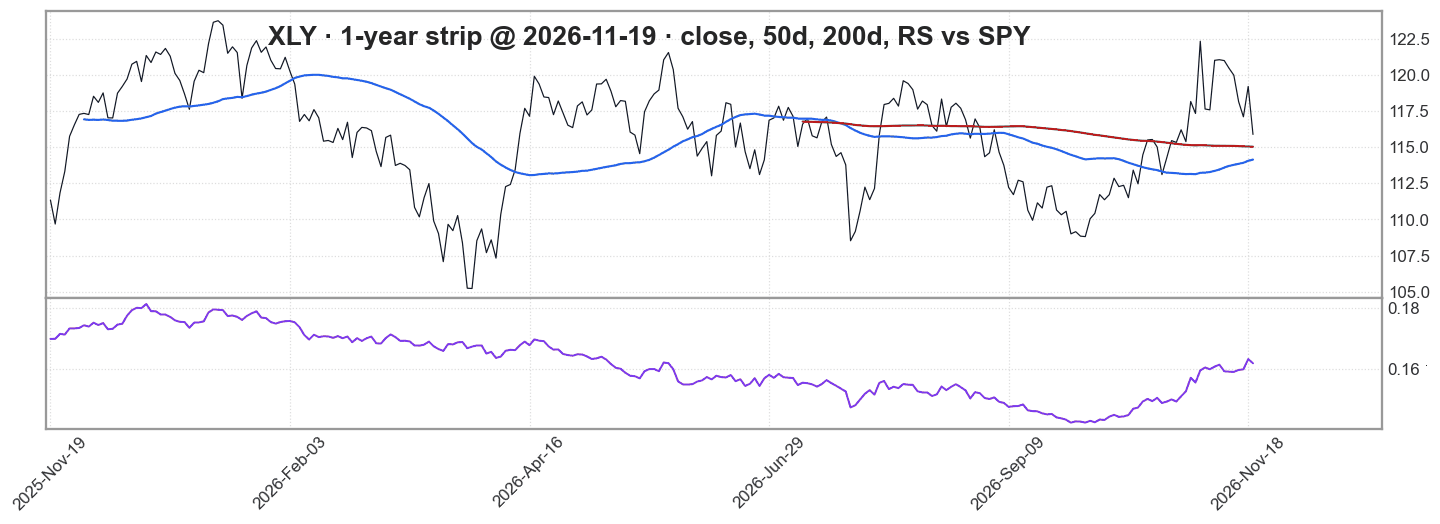
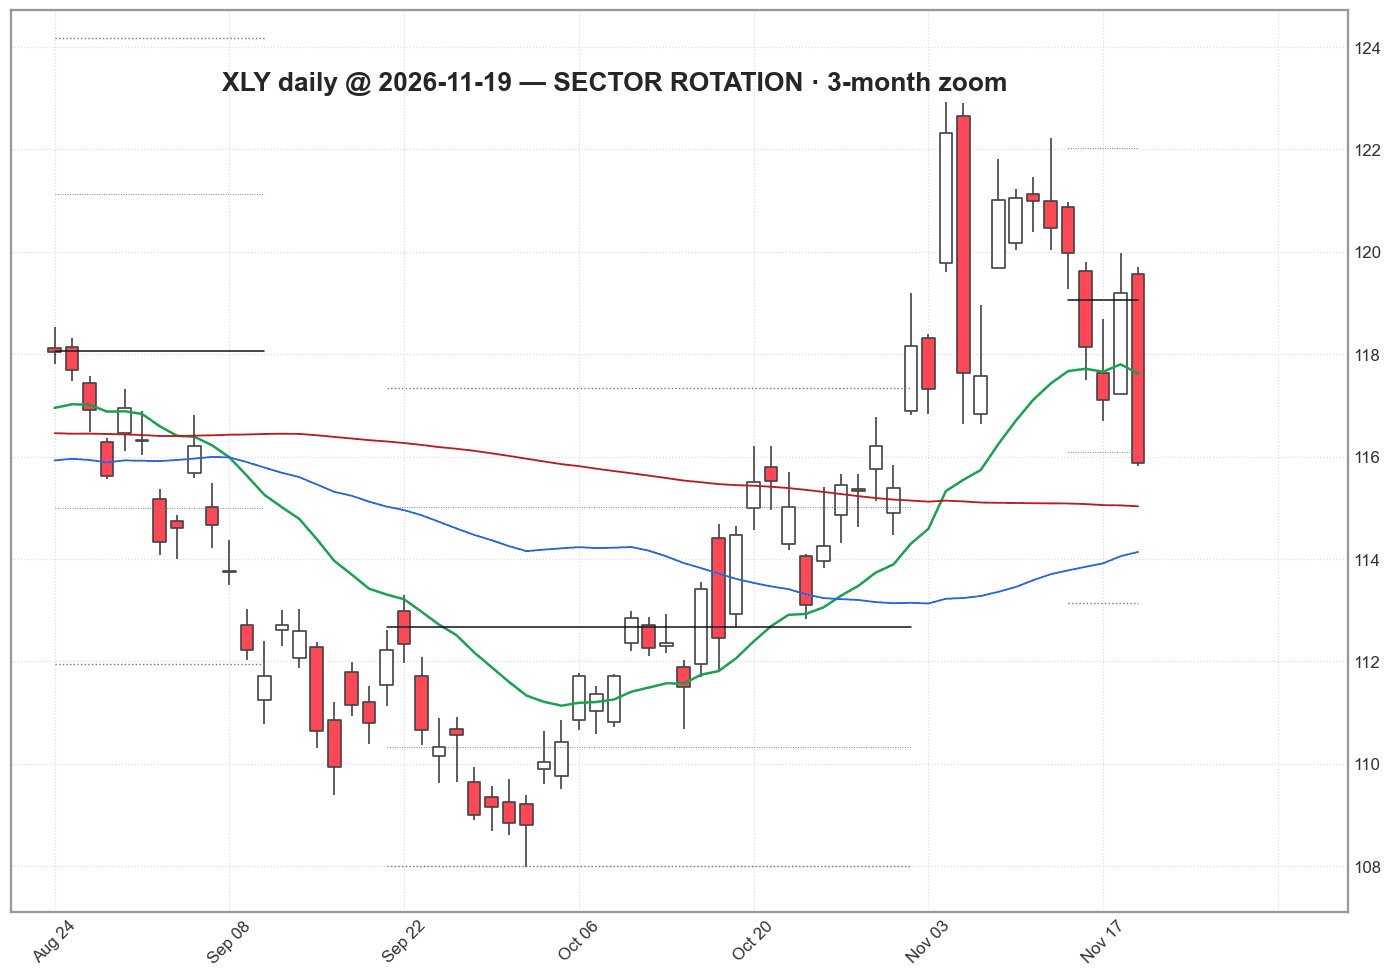
XLY · Discretionary · LEADING · 3M vs SPY +5.0%
price trend: strongPrices 2026-11-19Discretionary is leading: ahead of SPY over 3 months and still gaining. Versus SPY: +8.3% over 1 month, +5.0% over 3 months, +1.2% over 6 months. Price is above both of its 50- and 200-day averages. Narrative score +0 (confidence 0.4): Basing stage in relative strength with hopes for downtrend break vs staples (analyst); Flat-to-slightly green daily closes, neither leading nor lagging hard (retail). Against: BULL: Retail chart notes consumer discretionary not looking bad with potential leg higher in select names. Descriptive only; not a forecast. Source: Track A: Robinhood daily bars (Yahoo backup) through 2026-11-19; Track B: ADJ-2026-11-10 (validated)
| Quadrant | LEADING |
|---|---|
| A week ago | LEADING |
| 1M vs SPY | +8.3% |
| 3M vs SPY | +5.0% |
| 6M vs SPY | +1.2% |
| Change (1M−3M) | +3.3% |
| Breadth (top 10 beating SPY, 3M) | 9/10 |
| Narrative score | +0 |
| 20-day vol (ann.) | 30% |
XLF · Financials · LEADING · 3M vs SPY +3.5%
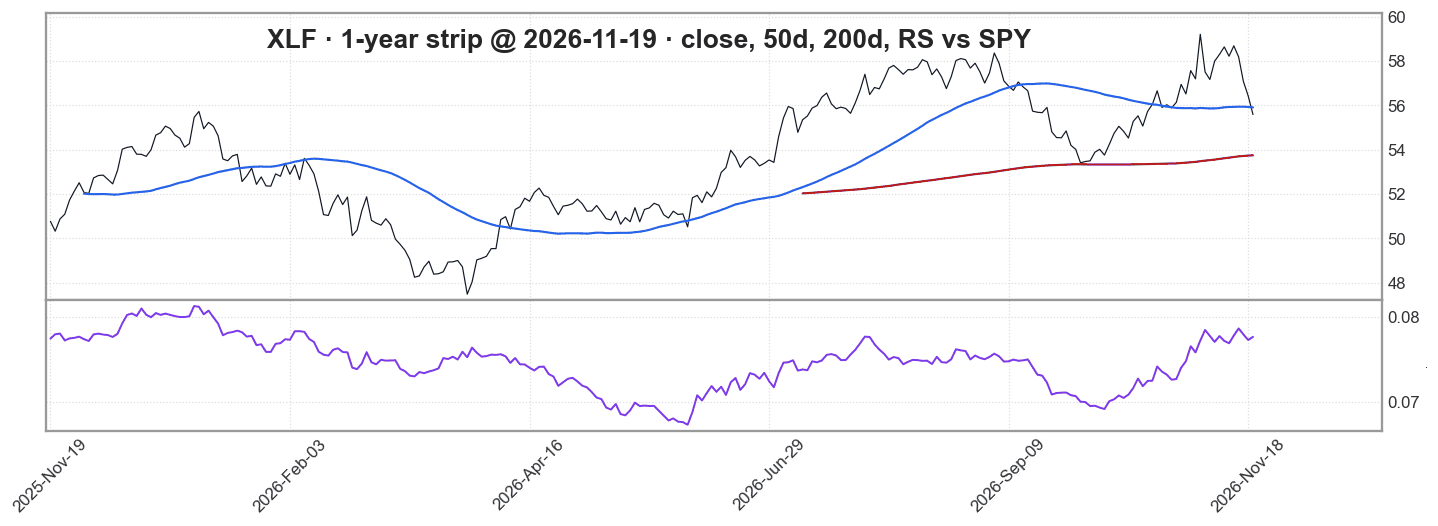
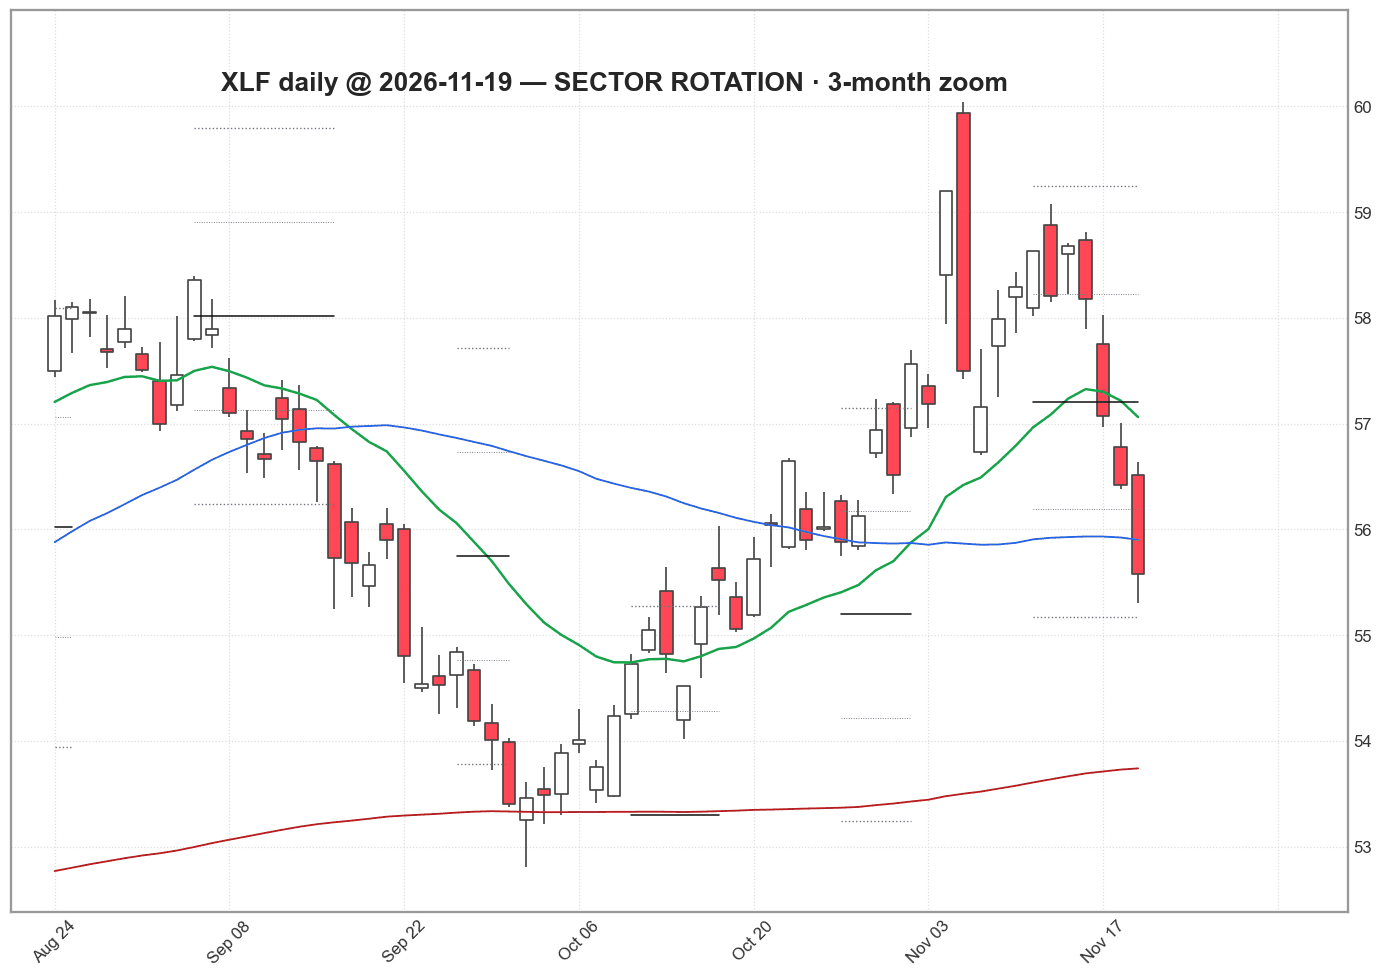
price trend: mixedPrices 2026-11-19Financials is leading: ahead of SPY over 3 months and still gaining. Versus SPY: +7.1% over 1 month, +3.5% over 3 months, +11.7% over 6 months. Price is mixed of its 50- and 200-day averages. Narrative score +2 (confidence 0.55): Daily recaps and heatmaps show financials leading green sectors post-CPI with relative outperformance (retail); Rotation commentary notes money moving into financials as tech weakens (analyst). Against: Earlier weekly RS rankings still listed financials as lagging overall despite one-day strength. Descriptive only; not a forecast. Source: Track A: Robinhood daily bars (Yahoo backup) through 2026-11-19; Track B: ADJ-2026-11-10 (validated)
| Quadrant | LEADING |
|---|---|
| A week ago | LEADING |
| 1M vs SPY | +7.1% |
| 3M vs SPY | +3.5% |
| 6M vs SPY | +11.7% |
| Change (1M−3M) | +3.6% |
| Breadth (top 10 beating SPY, 3M) | 4/10 |
| Narrative score | +2 |
| 20-day vol (ann.) | 23% |
XLRE · Real estate · LEADING · 3M vs SPY +2.3%
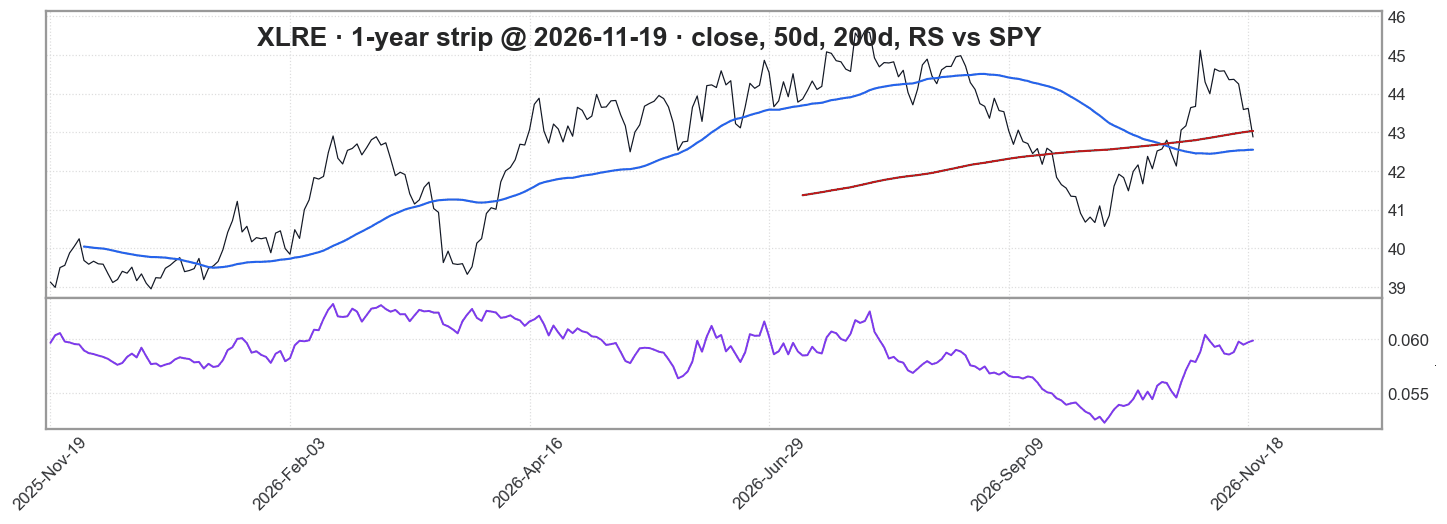
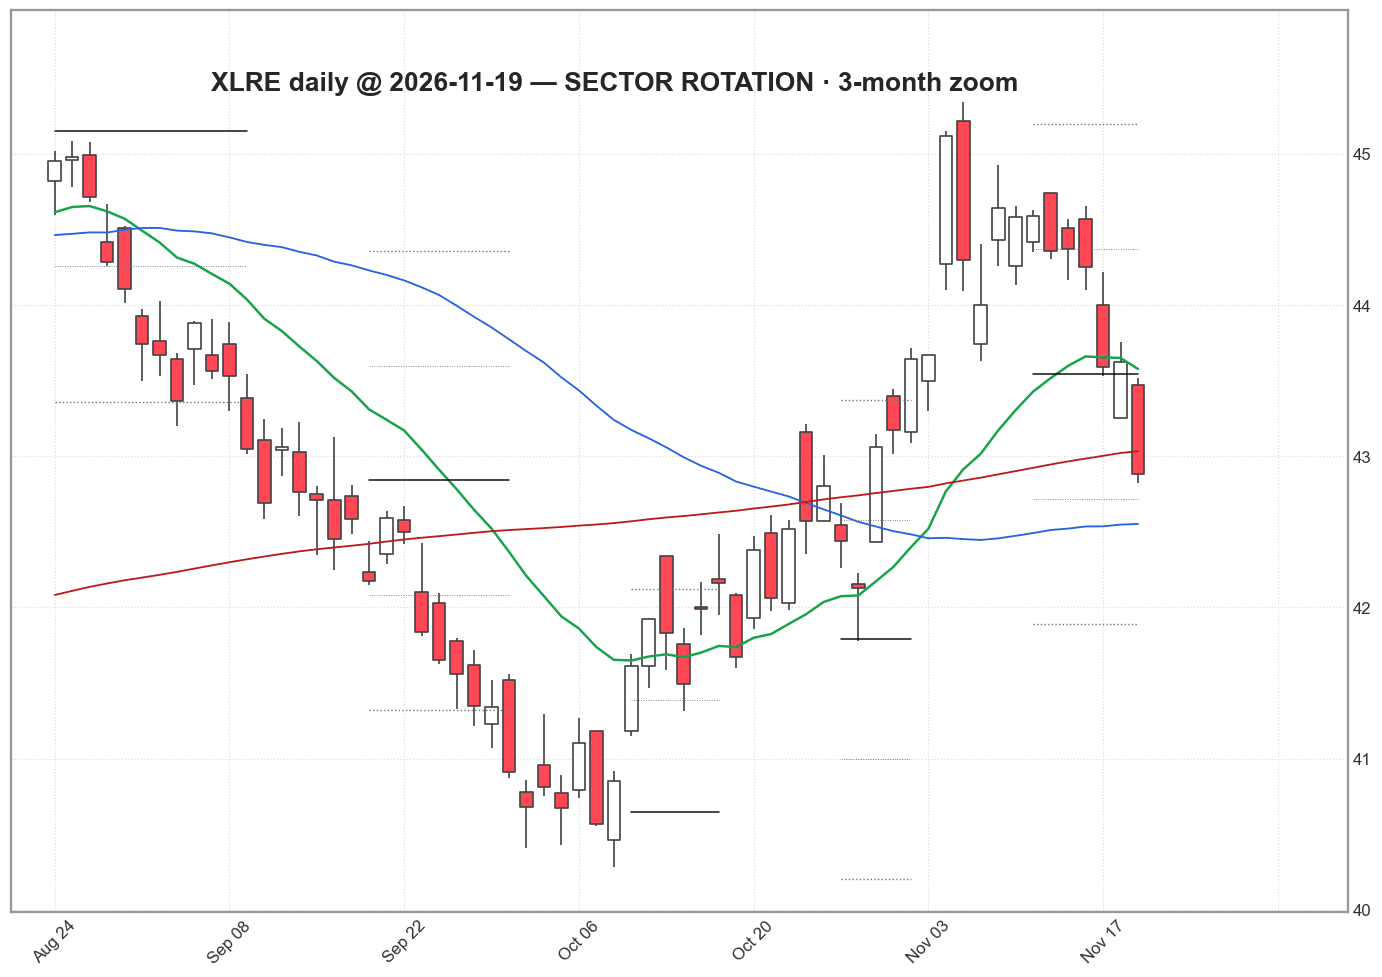
price trend: strongPrices 2026-11-19Real estate is leading: ahead of SPY over 3 months and still gaining. Versus SPY: +10.1% over 1 month, +2.3% over 3 months, +1.4% over 6 months. Price is mixed of its 50- and 200-day averages. Narrative score -2 (confidence 0.55): Yield spike pressure with red closes and fade candidates noted if rates rise (analyst); Lagging in daily sector lists amid duration sensitivity (retail). Against: One RS update briefly placed real estate into leading after energy rotation. Descriptive only; not a forecast. Source: Track A: Robinhood daily bars (Yahoo backup) through 2026-11-19; Track B: ADJ-2026-11-10 (validated)
| Quadrant | LEADING |
|---|---|
| A week ago | LEADING |
| 1M vs SPY | +10.1% |
| 3M vs SPY | +2.3% |
| 6M vs SPY | +1.4% |
| Change (1M−3M) | +7.8% |
| Breadth (top 10 beating SPY, 3M) | 6/10 |
| Narrative score | -2 |
| 20-day vol (ann.) | 20% |
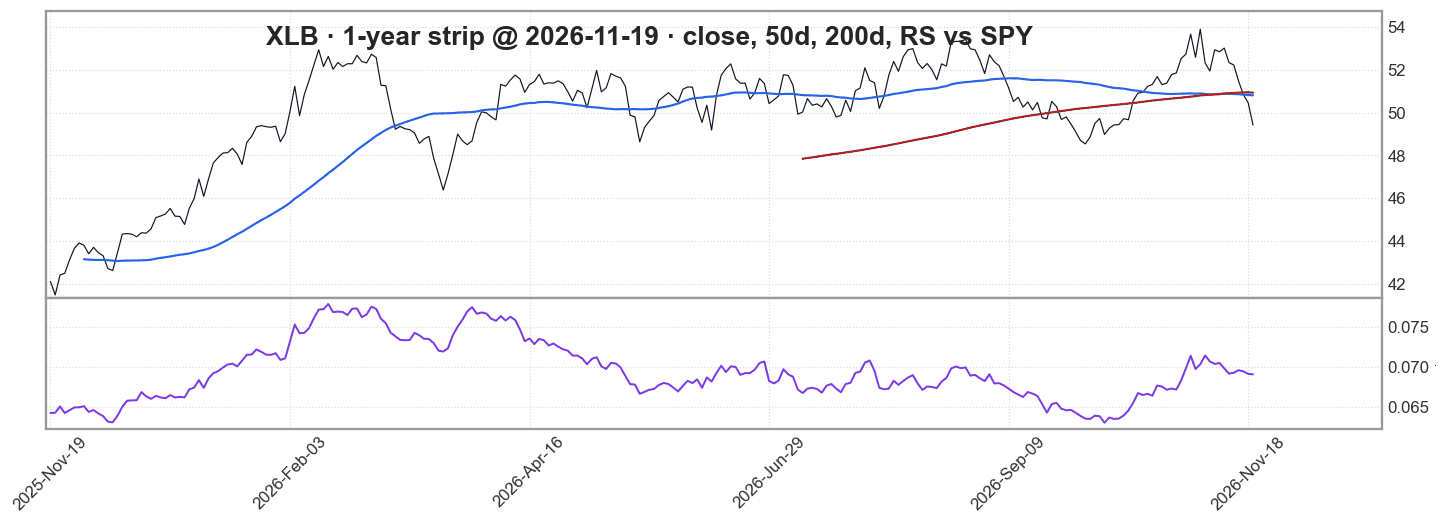
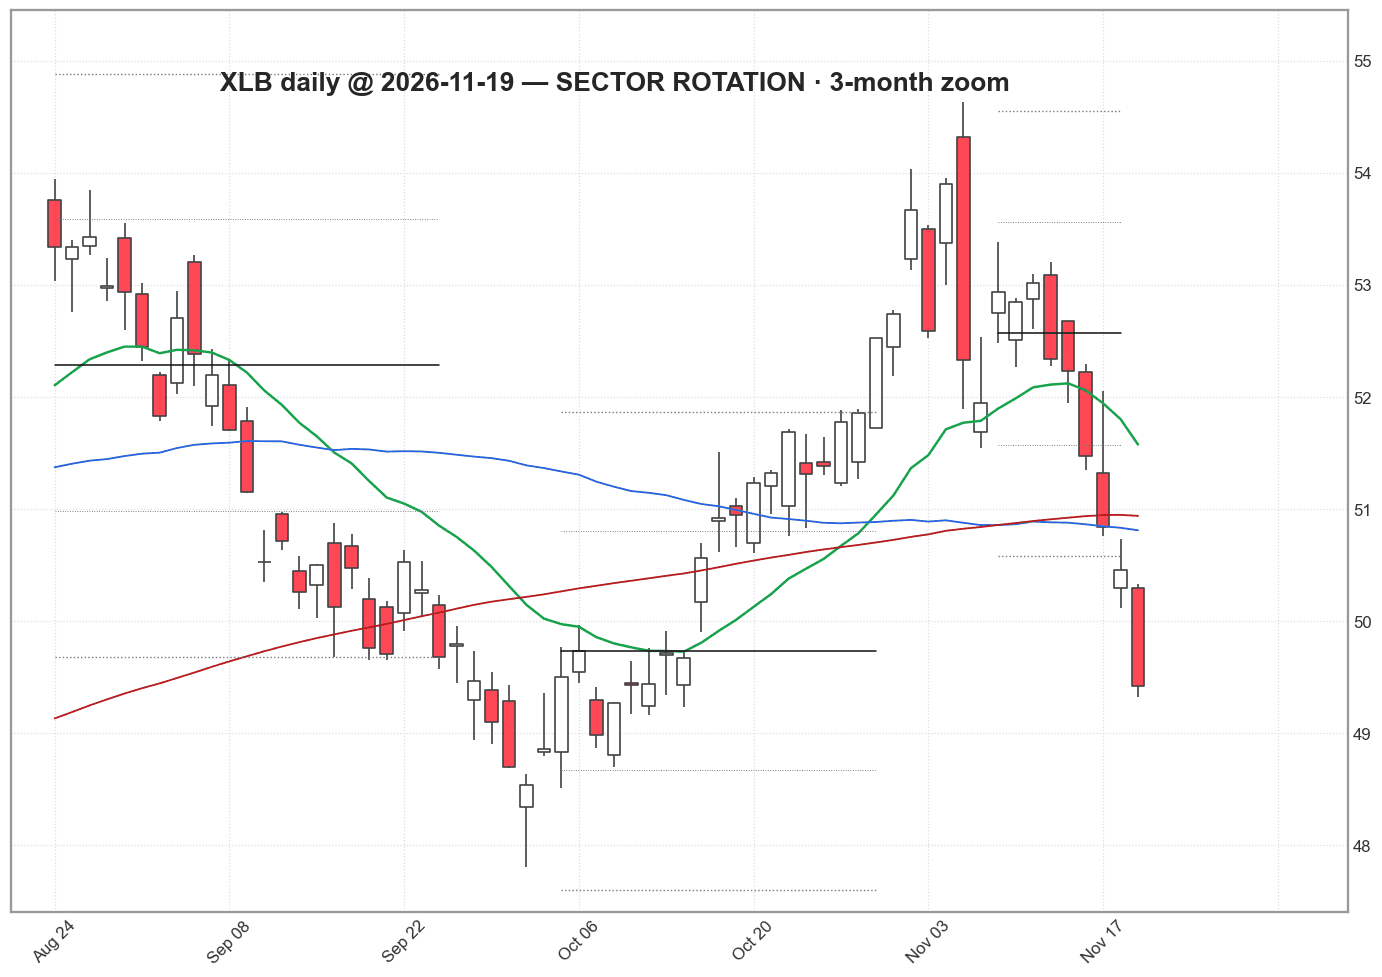
XLB · Materials · IMPROVING · 3M vs SPY -1.1%
price trend: mixedPrices 2026-11-19Materials is improving: behind SPY over 3 months but gaining over the last month. Versus SPY: +4.0% over 1 month, -1.1% over 3 months, +2.7% over 6 months. Price is below both of its 50- and 200-day averages. Narrative score +0 (confidence 0.4): Basing stage in RS with steel names showing isolated strength (flow_analyst); Mild red daily performance without strong narrative either way (retail). Against: BEAR: Materials closed red and listed among non-participants in post-CPI rotation. Descriptive only; not a forecast. Source: Track A: Robinhood daily bars (Yahoo backup) through 2026-11-19; Track B: ADJ-2026-11-10 (validated)
| Quadrant | IMPROVING |
|---|---|
| A week ago | LEADING |
| 1M vs SPY | +4.0% |
| 3M vs SPY | -1.1% |
| 6M vs SPY | +2.7% |
| Change (1M−3M) | +5.1% |
| Breadth (top 10 beating SPY, 3M) | 7/10 |
| Narrative score | +0 |
| 20-day vol (ann.) | 23% |
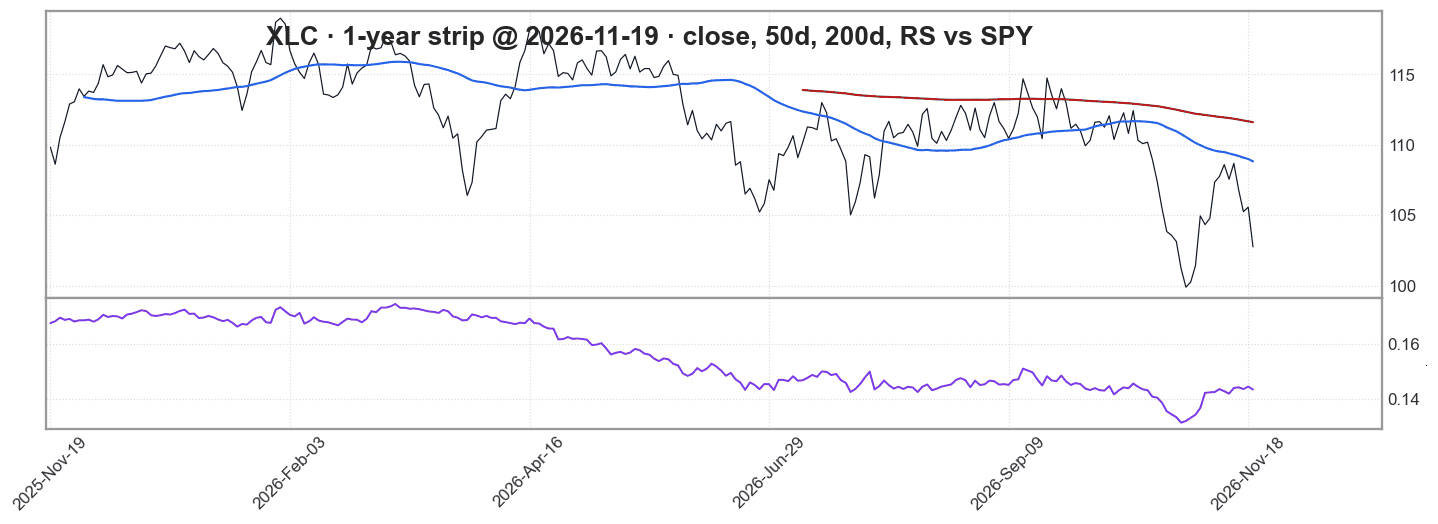
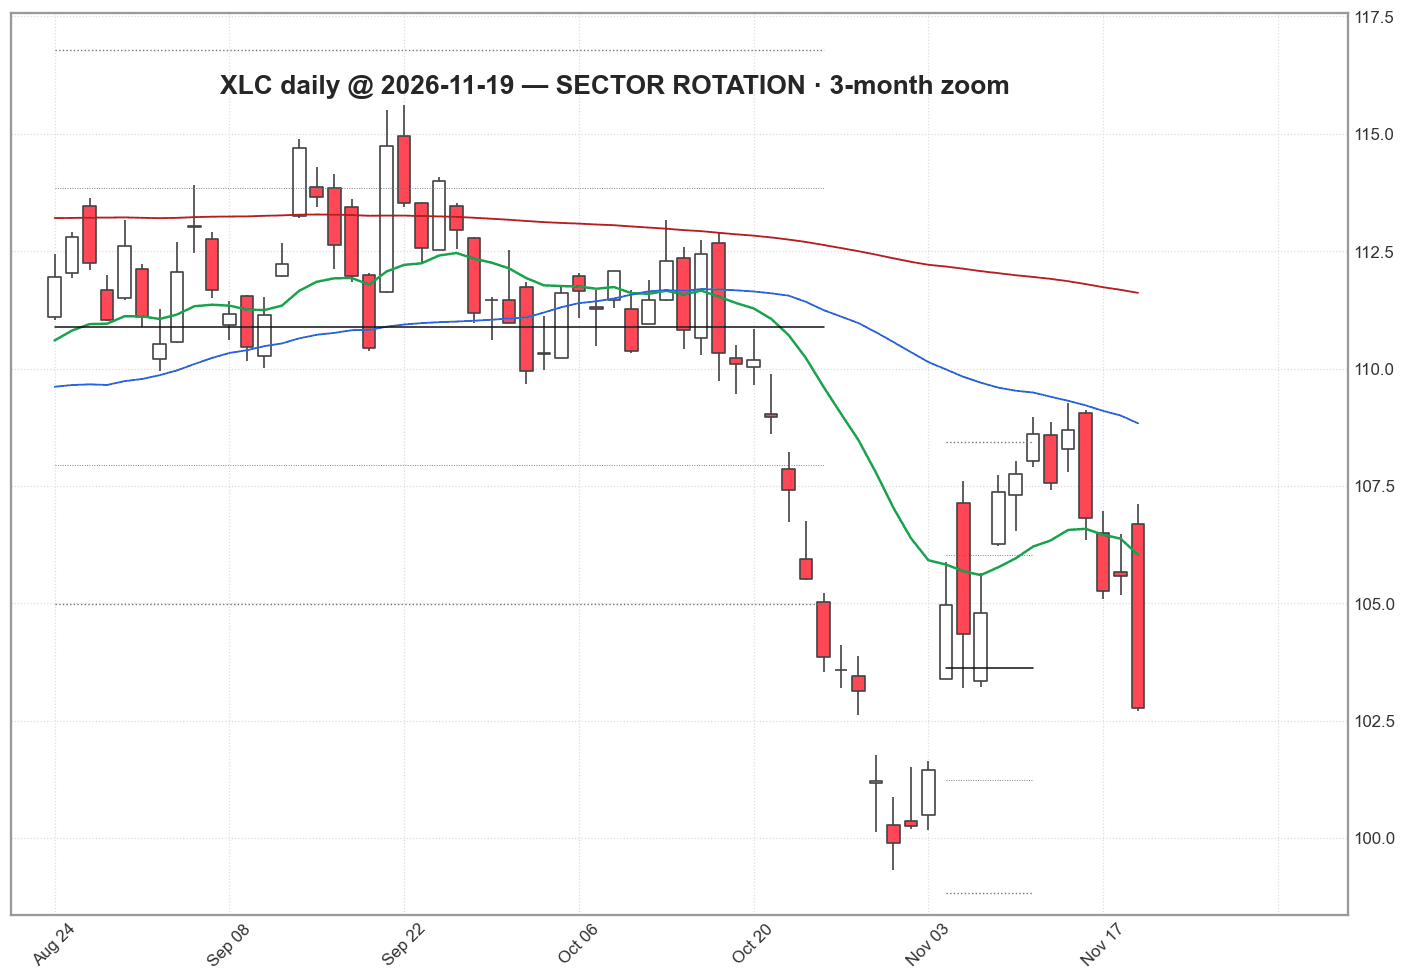
XLC · Communications · IMPROVING · 3M vs SPY -1.3%
price trend: mixedPrices 2026-11-19Communications is improving: behind SPY over 3 months but gaining over the last month. Versus SPY: +1.8% over 1 month, -1.3% over 3 months, -7.2% over 6 months. Price is below both of its 50- and 200-day averages. Narrative score -2 (confidence 0.5): Stage analysis shows declining quadrant despite some daily green (flow_analyst); Mixed: TTWO/GTA strength but overall not leading rotation (retail). Against: RS update noted communications crossing into improving with outperformance vs SPY in prior close. Descriptive only; not a forecast. Source: Track A: Robinhood daily bars (Yahoo backup) through 2026-11-19; Track B: ADJ-2026-11-10 (validated)
| Quadrant | IMPROVING |
|---|---|
| A week ago | IMPROVING |
| 1M vs SPY | +1.8% |
| 3M vs SPY | -1.3% |
| 6M vs SPY | -7.2% |
| Change (1M−3M) | +3.1% |
| Breadth (top 10 beating SPY, 3M) | 3/8 |
| Narrative score | -2 |
| 20-day vol (ann.) | 25% |
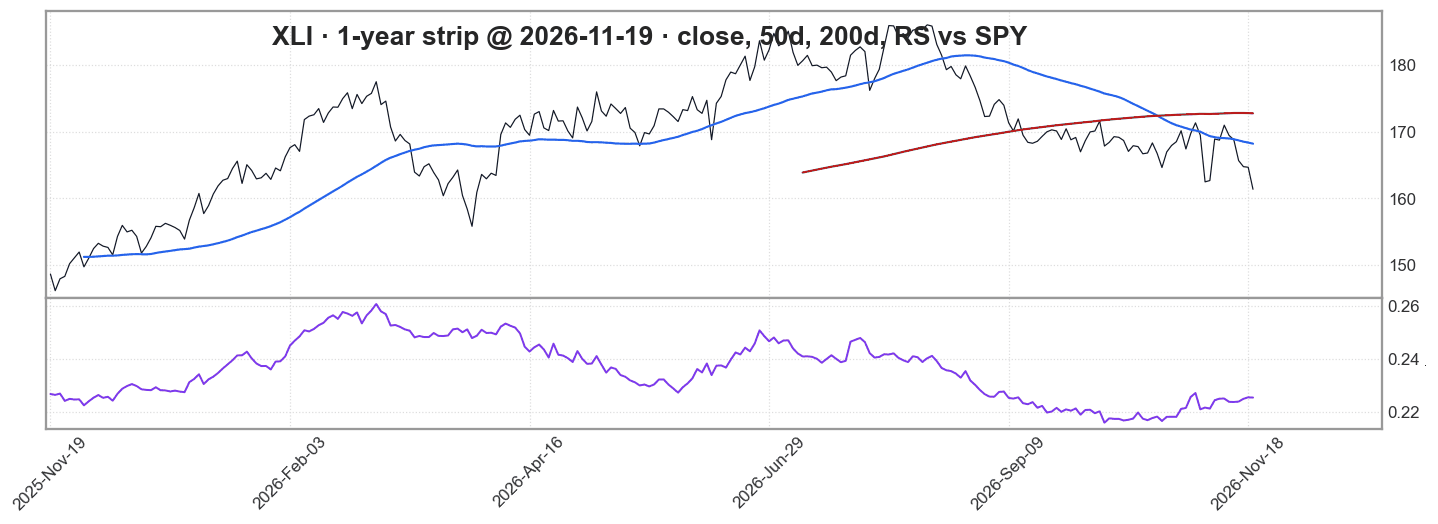
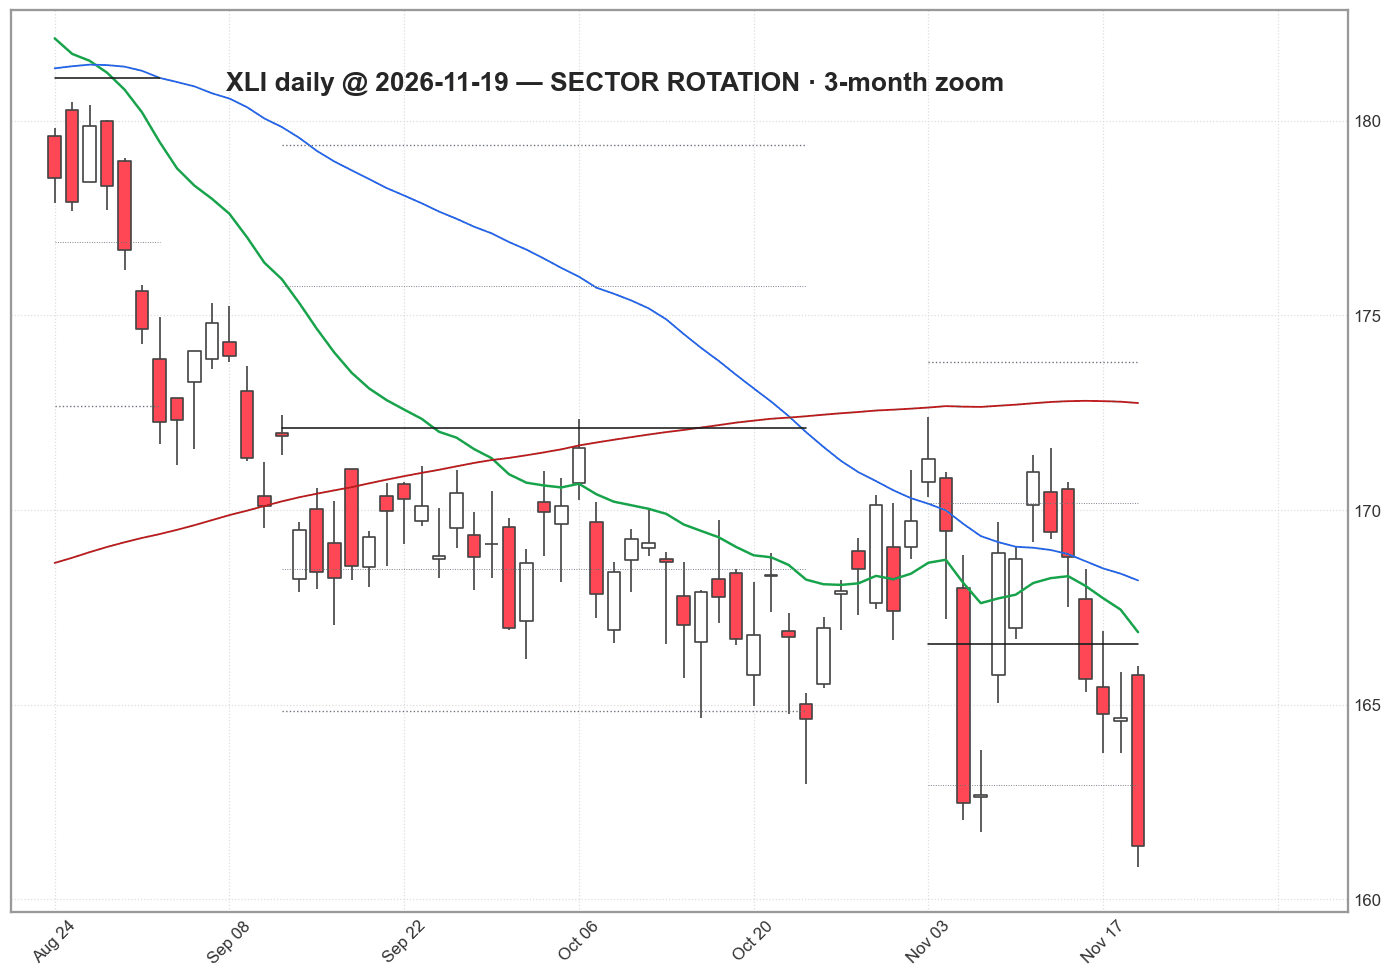
XLI · Industrials · IMPROVING · 3M vs SPY -4.2%
price trend: mixedPrices 2026-11-19Industrials is improving: behind SPY over 3 months but gaining over the last month. Versus SPY: +3.5% over 1 month, -4.2% over 3 months, -2.1% over 6 months. Price is below both of its 50- and 200-day averages. Narrative score -2 (confidence 0.5): Stage/RS charts place industrials in declining/lagging quadrant (flow_analyst); Daily performance near-flat to red amid broader rotation away from cyclicals (retail). Against: Isolated stock-level strength in names like RKLB on backlog news lifting some industrial sentiment. Descriptive only; not a forecast. Source: Track A: Robinhood daily bars (Yahoo backup) through 2026-11-19; Track B: ADJ-2026-11-10 (validated)
| Quadrant | IMPROVING |
|---|---|
| A week ago | IMPROVING |
| 1M vs SPY | +3.5% |
| 3M vs SPY | -4.2% |
| 6M vs SPY | -2.1% |
| Change (1M−3M) | +7.8% |
| Breadth (top 10 beating SPY, 3M) | 2/10 |
| Narrative score | -2 |
| 20-day vol (ann.) | 27% |
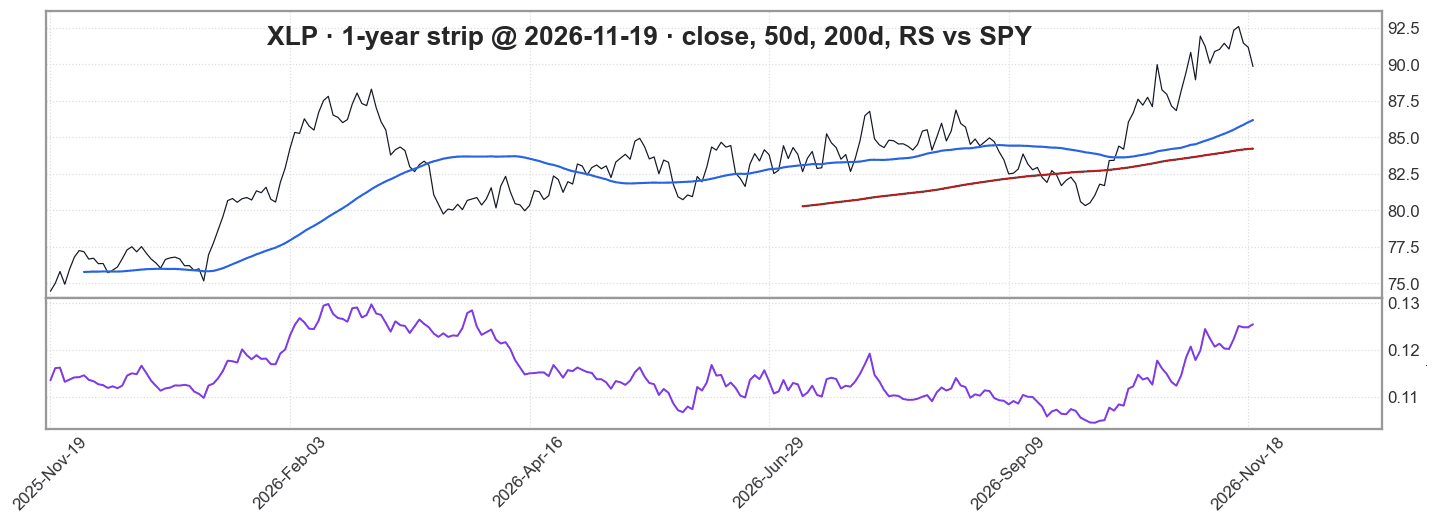
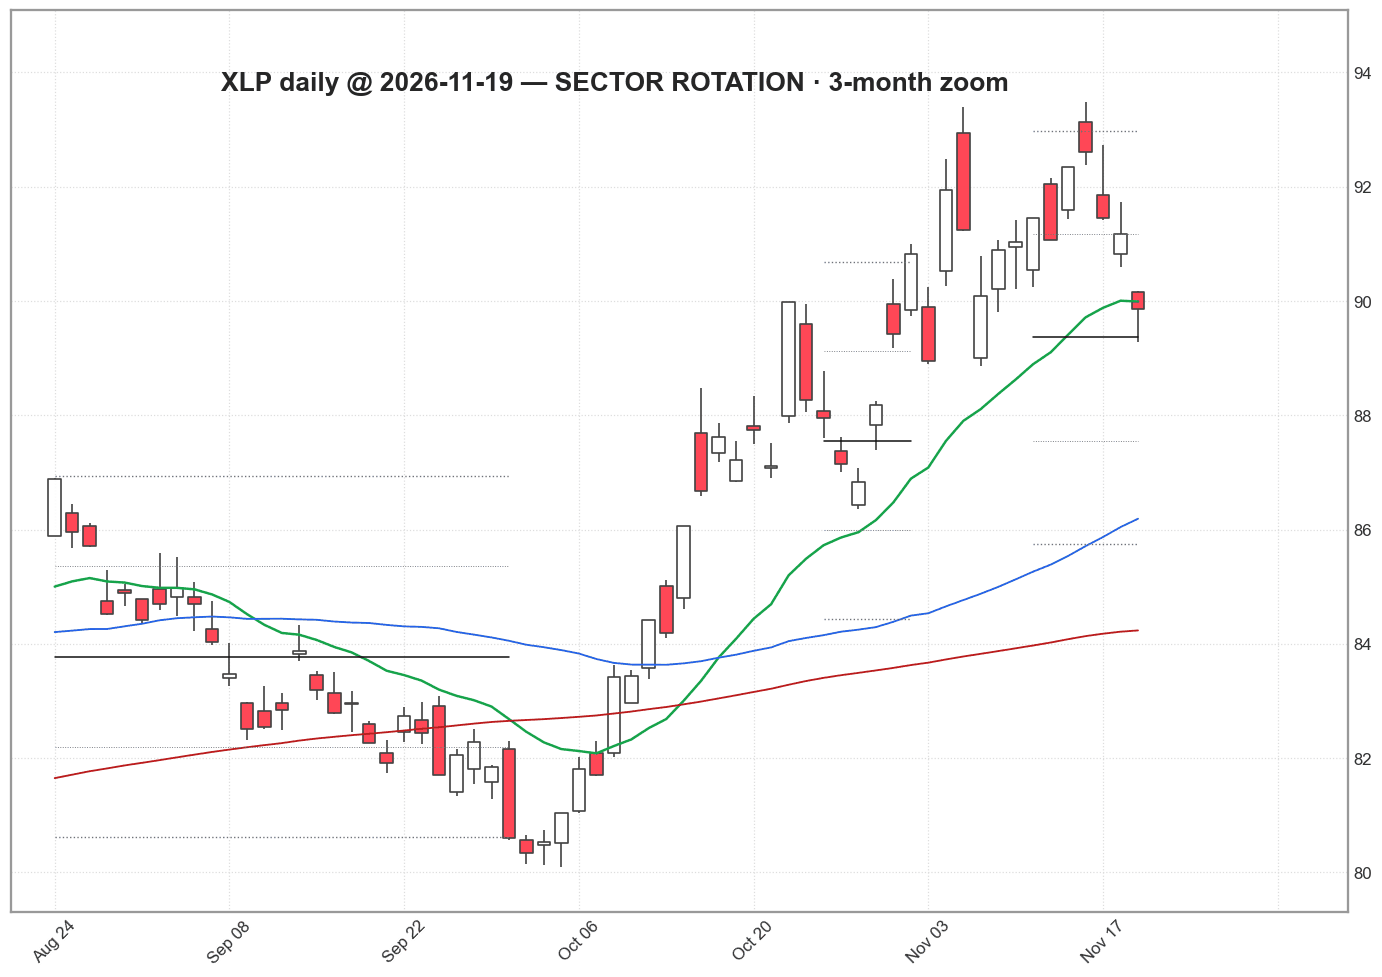
XLP · Staples · WEAKENING · 3M vs SPY +12.2%
price trend: strongPrices 2026-11-19Staples is weakening: ahead of SPY over 3 months but losing ground over the last month. Versus SPY: +11.4% over 1 month, +12.2% over 3 months, +11.3% over 6 months. Price is above both of its 50- and 200-day averages. Narrative score +2 (confidence 0.65): Advancing stage and defensive leadership in rotation from tech/growth (flow_analyst); Heatmaps show staples taking over as new leader post-CPI (analyst). Against: Equal-weight vs cap-weight charts still in downtrend needing break for confirmation. Descriptive only; not a forecast. Source: Track A: Robinhood daily bars (Yahoo backup) through 2026-11-19; Track B: ADJ-2026-11-10 (validated)
| Quadrant | WEAKENING |
|---|---|
| A week ago | WEAKENING |
| 1M vs SPY | +11.4% |
| 3M vs SPY | +12.2% |
| 6M vs SPY | +11.3% |
| Change (1M−3M) | -0.8% |
| Breadth (top 10 beating SPY, 3M) | 9/10 |
| Narrative score | +2 |
| 20-day vol (ann.) | 22% |
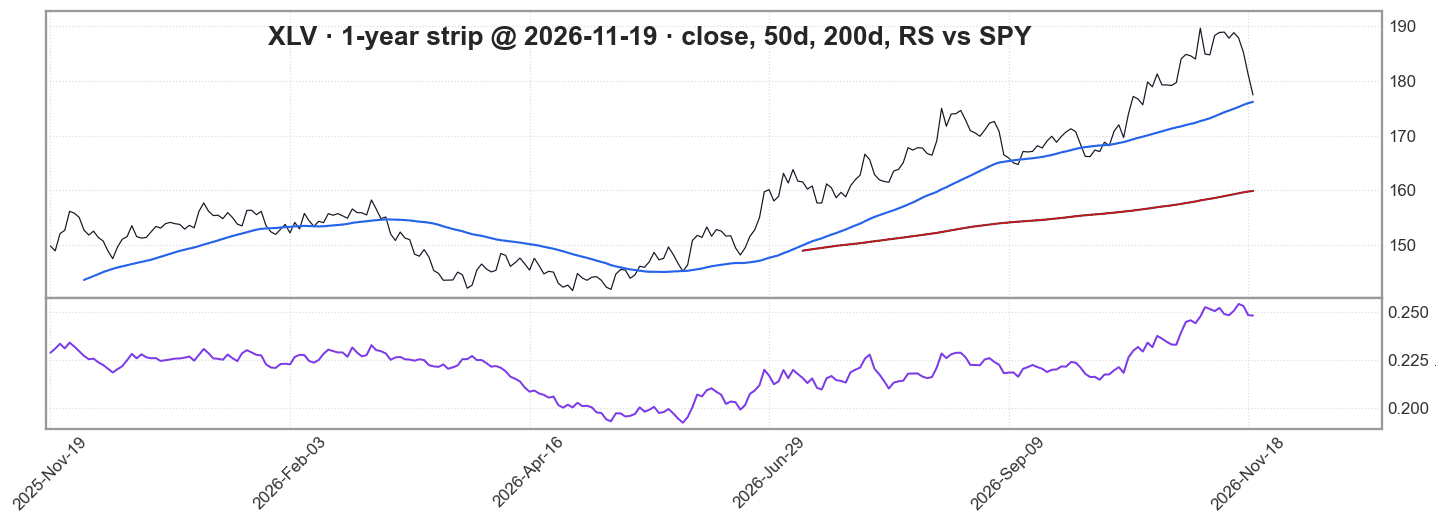
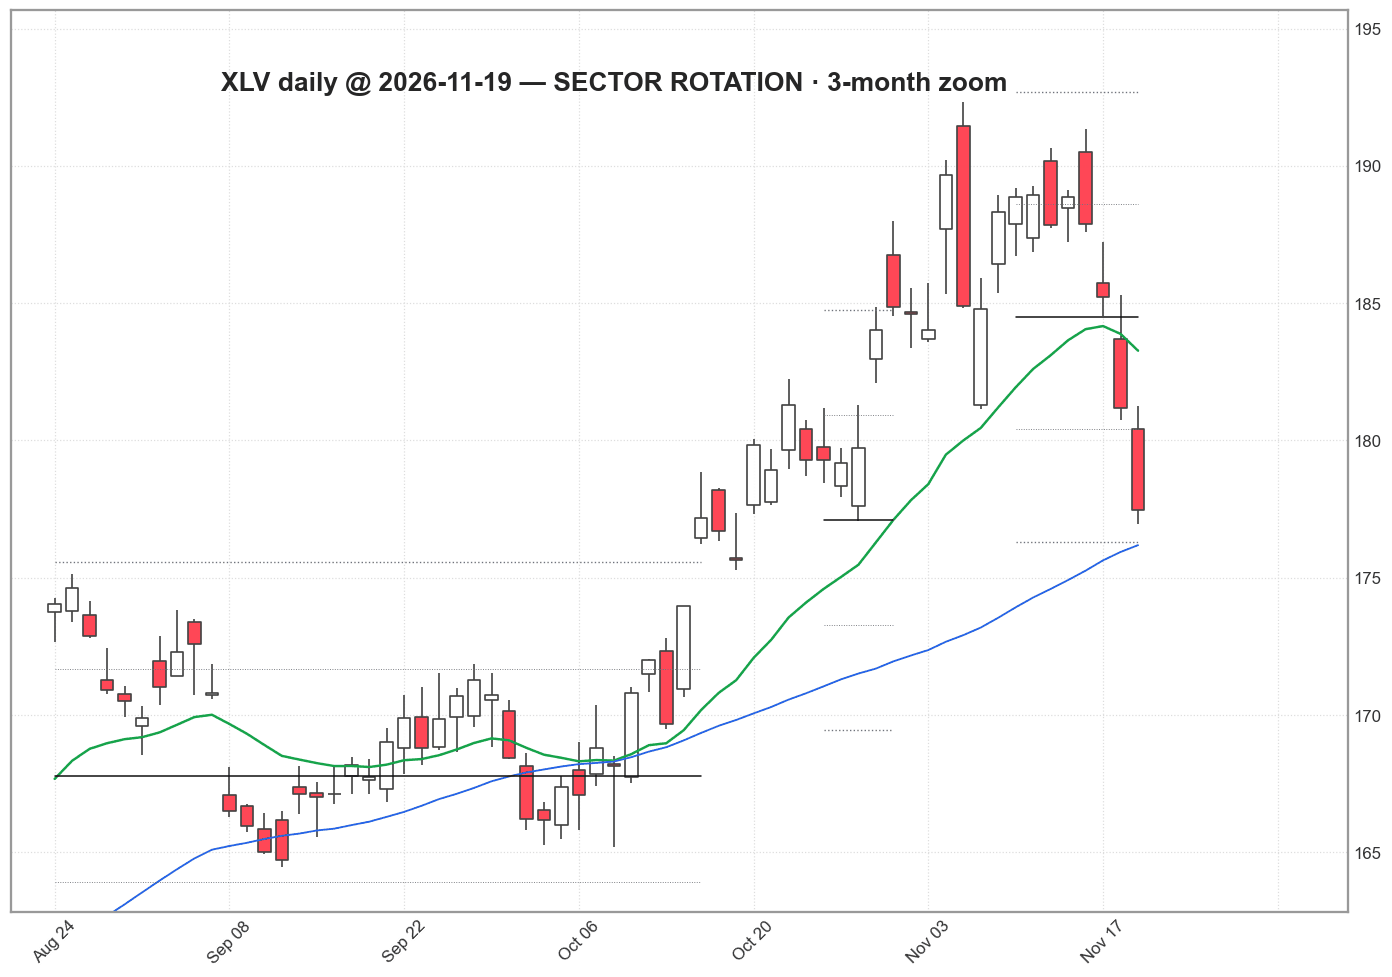
XLV · Health care · WEAKENING · 3M vs SPY +8.8%
price trend: strongPrices 2026-11-19Health care is weakening: ahead of SPY over 3 months but losing ground over the last month. Versus SPY: +7.1% over 1 month, +8.8% over 3 months, +23.7% over 6 months. Price is above both of its 50- and 200-day averages. Narrative score +4 (confidence 0.8): Explicit leadership calls with XLV 10% one-month vs XLK -14%, defensive rotation building (analyst); Stage analysis places healthcare in advancing leaders (flow_analyst). Against: Minor midday snapshot showing brief flat-to-red before closing green. Descriptive only; not a forecast. Source: Track A: Robinhood daily bars (Yahoo backup) through 2026-11-19; Track B: ADJ-2026-11-10 (validated)
| Quadrant | WEAKENING |
|---|---|
| A week ago | WEAKENING |
| 1M vs SPY | +7.1% |
| 3M vs SPY | +8.8% |
| 6M vs SPY | +23.7% |
| Change (1M−3M) | -1.7% |
| Breadth (top 10 beating SPY, 3M) | 7/10 |
| Narrative score | +4 |
| 20-day vol (ann.) | 23% |
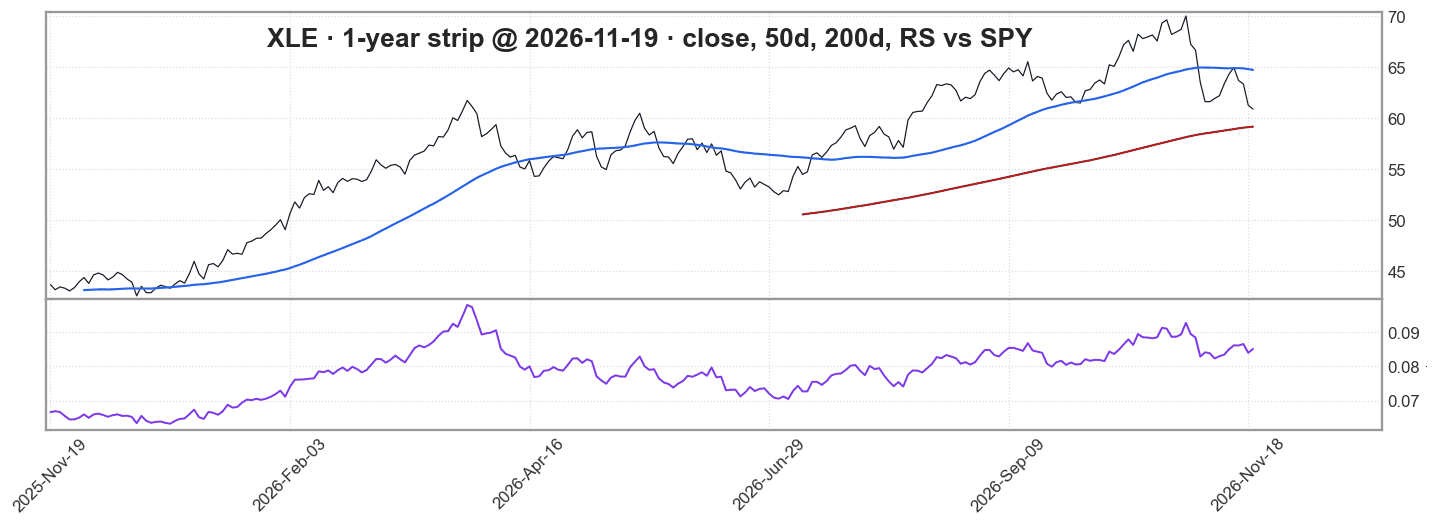
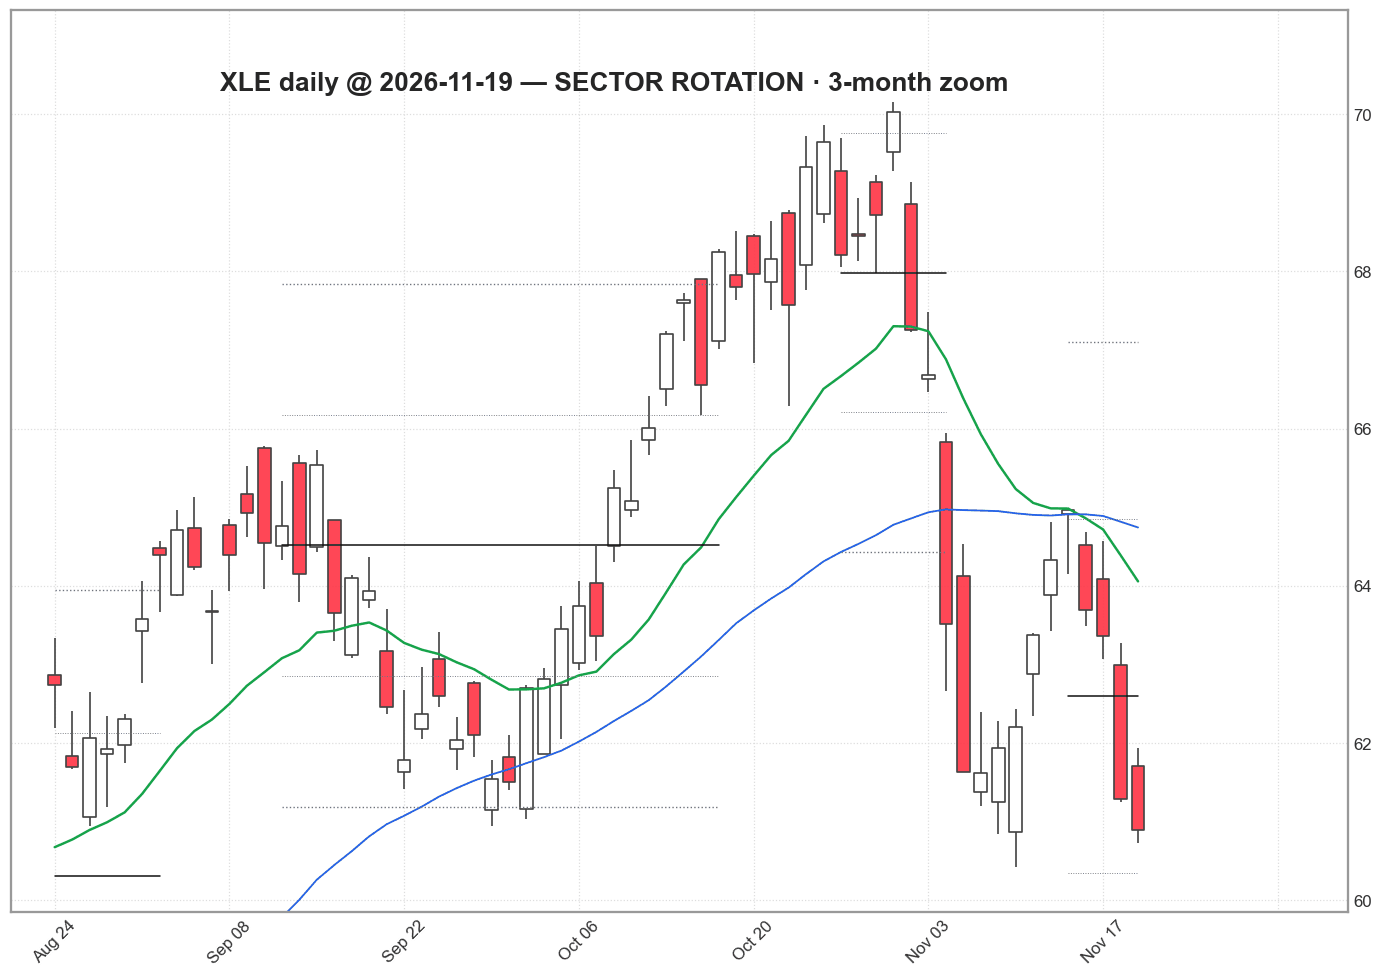
XLE · Energy · WEAKENING · 3M vs SPY +2.7%
price trend: mixedPrices 2026-11-19Energy is weakening: ahead of SPY over 3 months but losing ground over the last month. Versus SPY: -3.5% over 1 month, +2.7% over 3 months, +7.5% over 6 months. Price is mixed of its 50- and 200-day averages. Narrative score +3 (confidence 0.7): Multiple RS/rotation posts rank energy as top leader with advancing stage (flow_analyst); Retail traders noting bullish engulfing/daily candles and taking long oil-related positions (retail). Against: One retail note on XLE MTD underperformance and oil premium stripping on diplomacy hopes. Descriptive only; not a forecast. Source: Track A: Robinhood daily bars (Yahoo backup) through 2026-11-19; Track B: ADJ-2026-11-10 (validated)
| Quadrant | WEAKENING |
|---|---|
| A week ago | WEAKENING |
| 1M vs SPY | -3.5% |
| 3M vs SPY | +2.7% |
| 6M vs SPY | +7.5% |
| Change (1M−3M) | -6.2% |
| Breadth (top 10 beating SPY, 3M) | 9/10 |
| Narrative score | +3 |
| 20-day vol (ann.) | 33% |
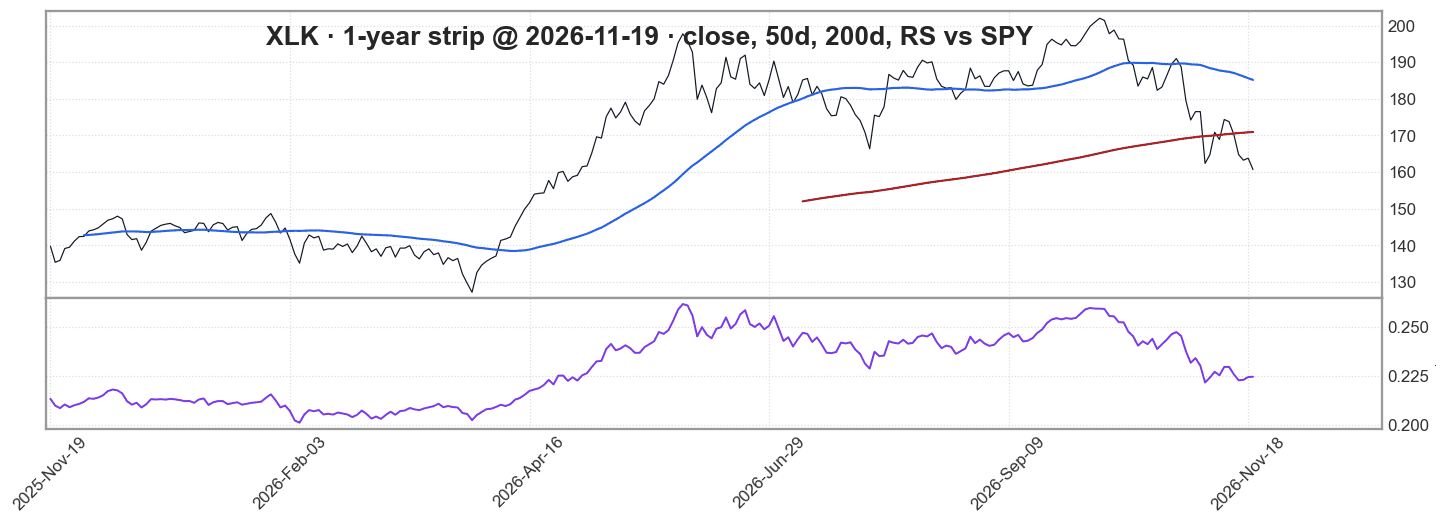
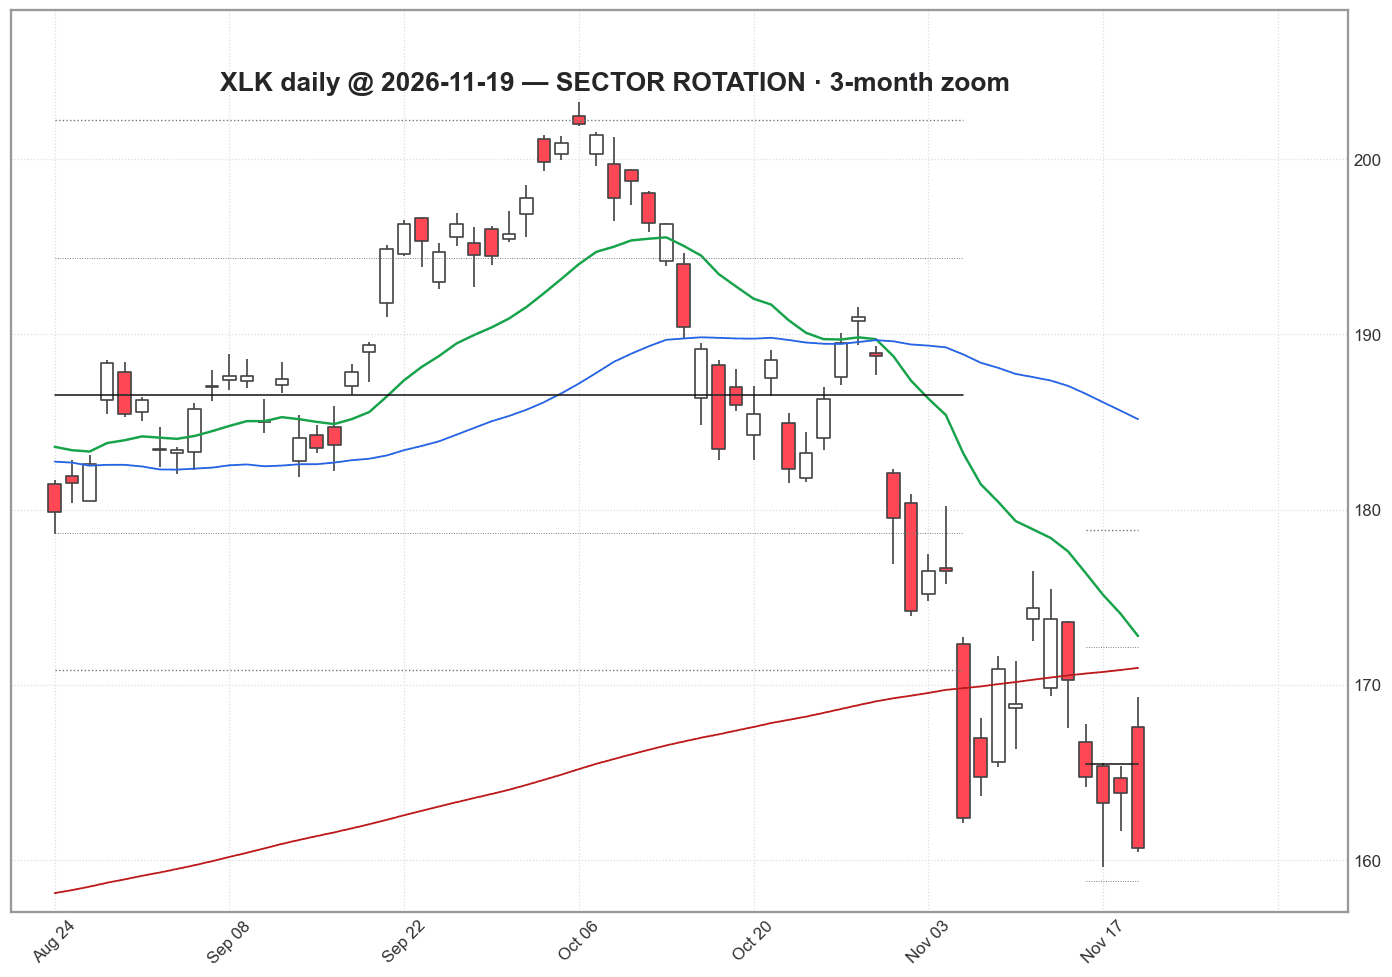
XLK · Technology · LAGGING · 3M vs SPY -6.4%
price trend: weakPrices 2026-11-19Technology is lagging: behind SPY over 3 months and still losing ground. Versus SPY: -8.0% over 1 month, -6.4% over 3 months, -7.5% over 6 months. Price is below both of its 50- and 200-day averages. Narrative score -4 (confidence 0.75): Analyst downgrade to underweight amid ongoing Nasdaq correction and AI/chip weakness (analyst); Retail and recap accounts highlight tech as sole major drag with NVDA governance issues sinking breadth (retail). Against: Isolated retail notes of oversold bounce potential in semis like AVGO holding relative strength amid broader XLK damage. Descriptive only; not a forecast. Source: Track A: Robinhood daily bars (Yahoo backup) through 2026-11-19; Track B: ADJ-2026-11-10 (validated)
| Quadrant | LAGGING |
|---|---|
| A week ago | LAGGING |
| 1M vs SPY | -8.0% |
| 3M vs SPY | -6.4% |
| 6M vs SPY | -7.5% |
| Change (1M−3M) | -1.6% |
| Breadth (top 10 beating SPY, 3M) | 4/10 |
| Narrative score | -4 |
| 20-day vol (ann.) | 44% |
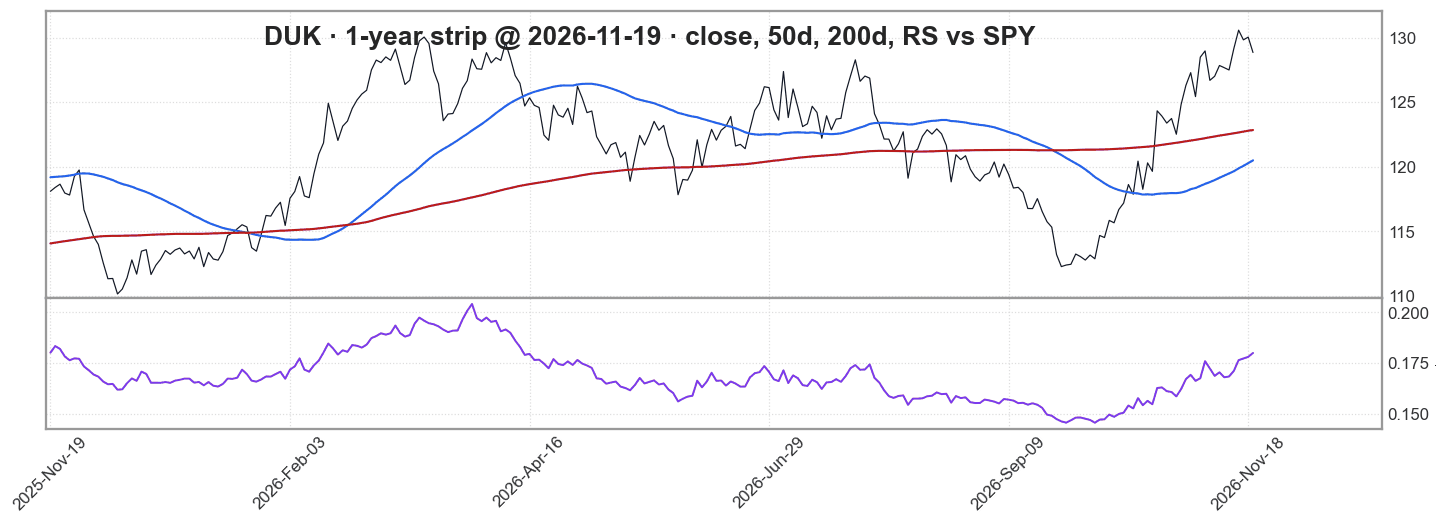
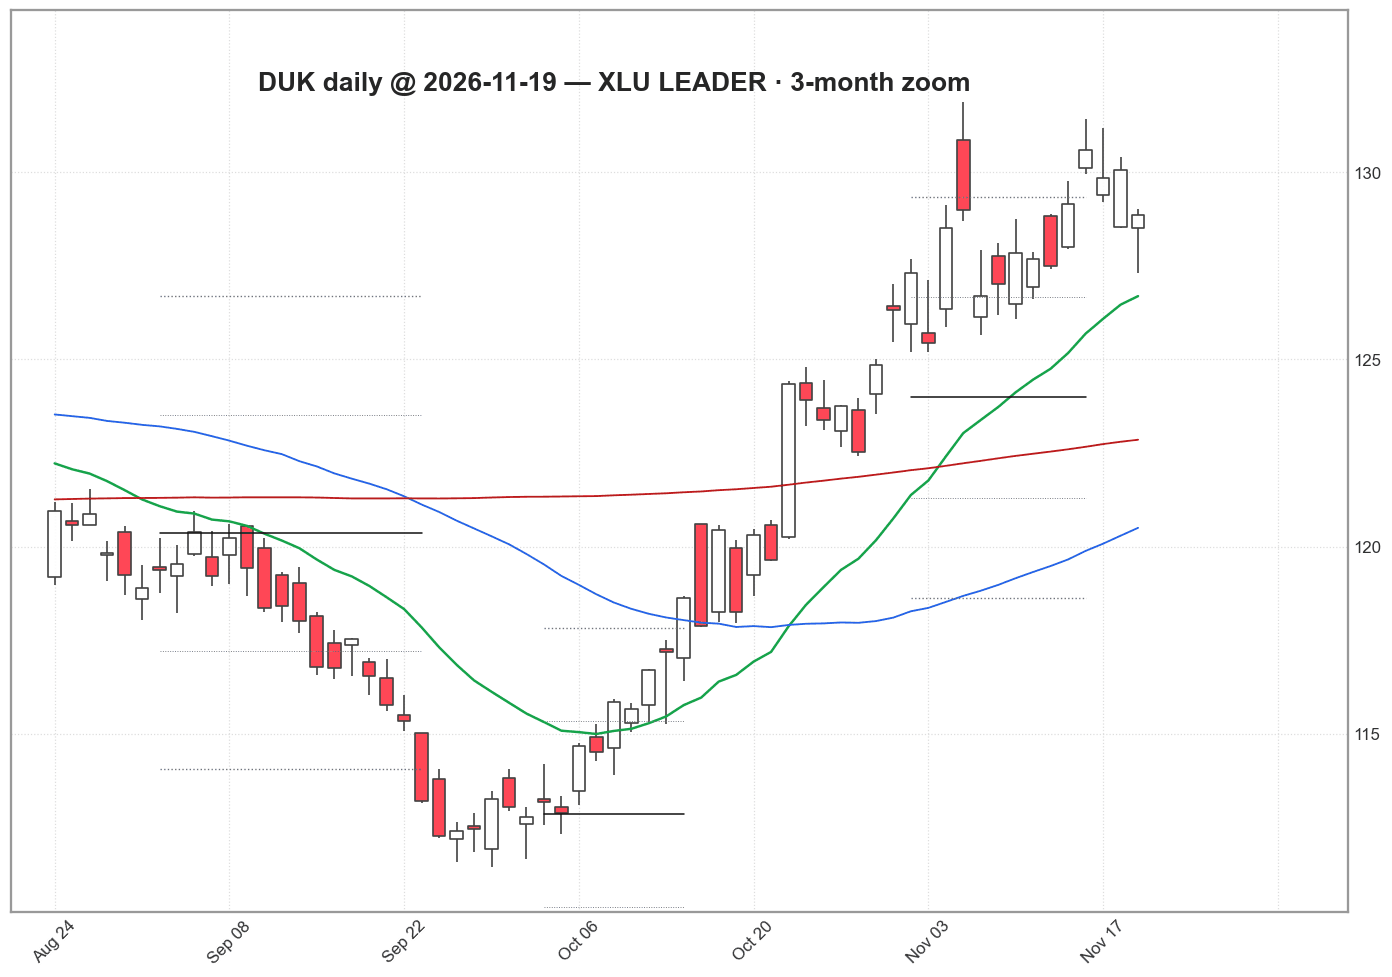
DUK · strongest of XLU top holdings · 3M vs SPY +15.7%
price trend: strongPrices 2026-11-19Best 3-month relative strength among the top 10 holdings of XLU (Utilities, currently leading). Holdings list as of 2026-08-06. Descriptive only. Source: holdings_cache.json (2026-08-06); Robinhood daily bars (Yahoo backup)
| Sector | XLU · Utilities |
|---|---|
| Sector quadrant | LEADING |
| 3M vs SPY | +15.7% |
| Sector breadth | 7/10 |
MAR · strongest of XLY top holdings · 3M vs SPY +24.0%
price trend: strongPrices 2026-11-19Best 3-month relative strength among the top 10 holdings of XLY (Discretionary, currently leading). Holdings list as of 2026-07-21. Descriptive only. Source: holdings_cache.json (2026-07-21); Robinhood daily bars (Yahoo backup)
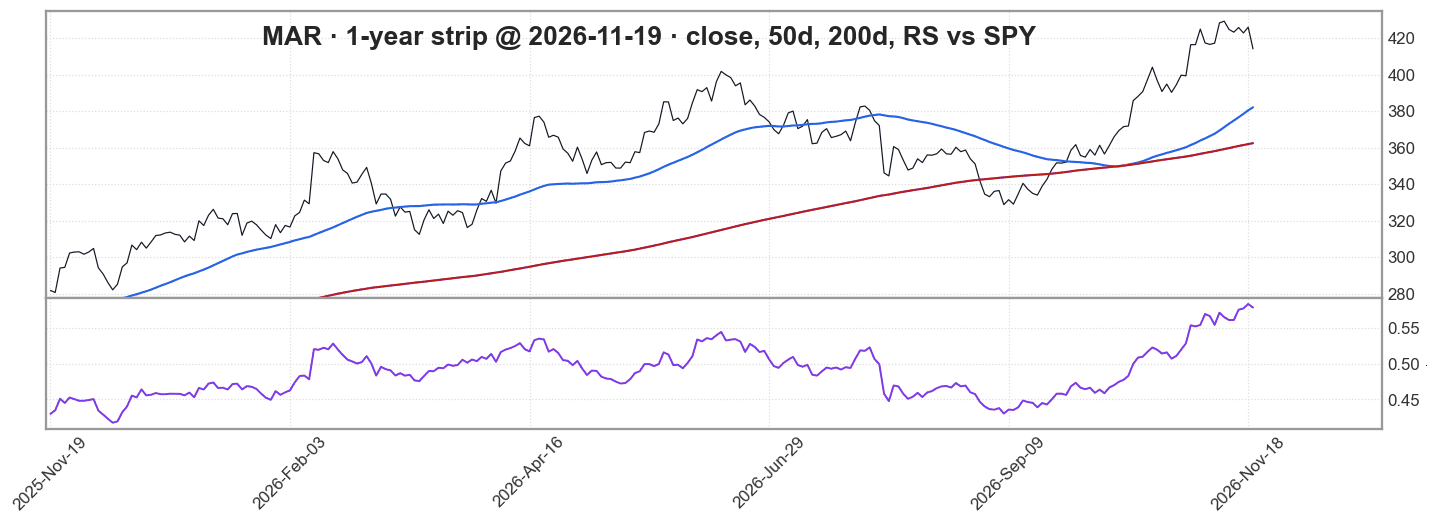
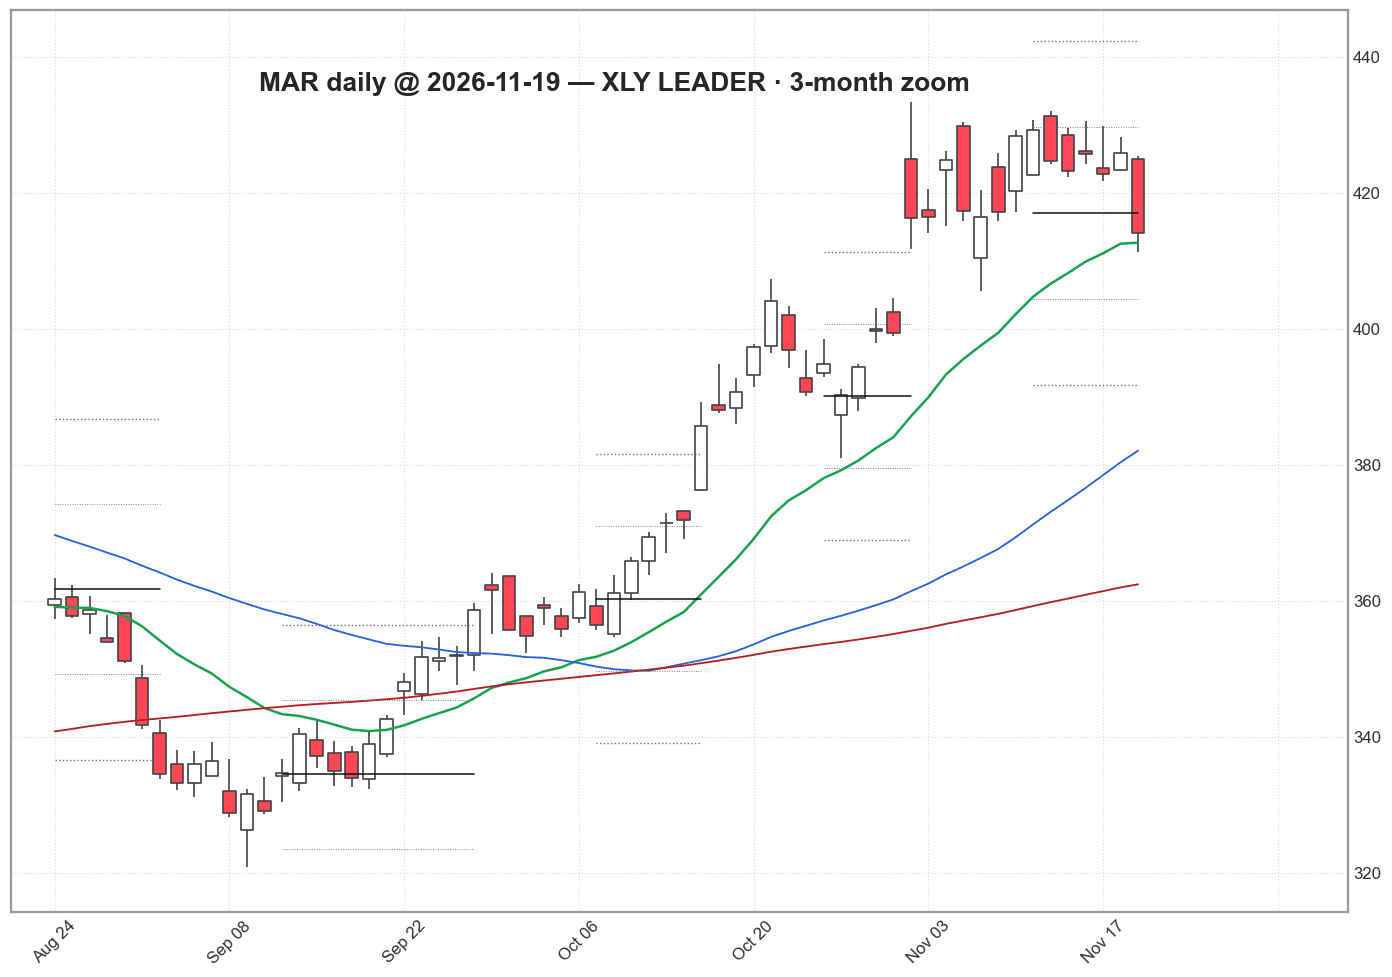
| Sector | XLY · Discretionary |
|---|---|
| Sector quadrant | LEADING |
| 3M vs SPY | +24.0% |
| Sector breadth | 9/10 |
BRK-B · strongest of XLF top holdings · 3M vs SPY +23.4%
price trend: strongPrices 2026-11-19Best 3-month relative strength among the top 10 holdings of XLF (Financials, currently leading). Holdings list as of 2026-07-21. Descriptive only. Source: holdings_cache.json (2026-07-21); Robinhood daily bars (Yahoo backup)
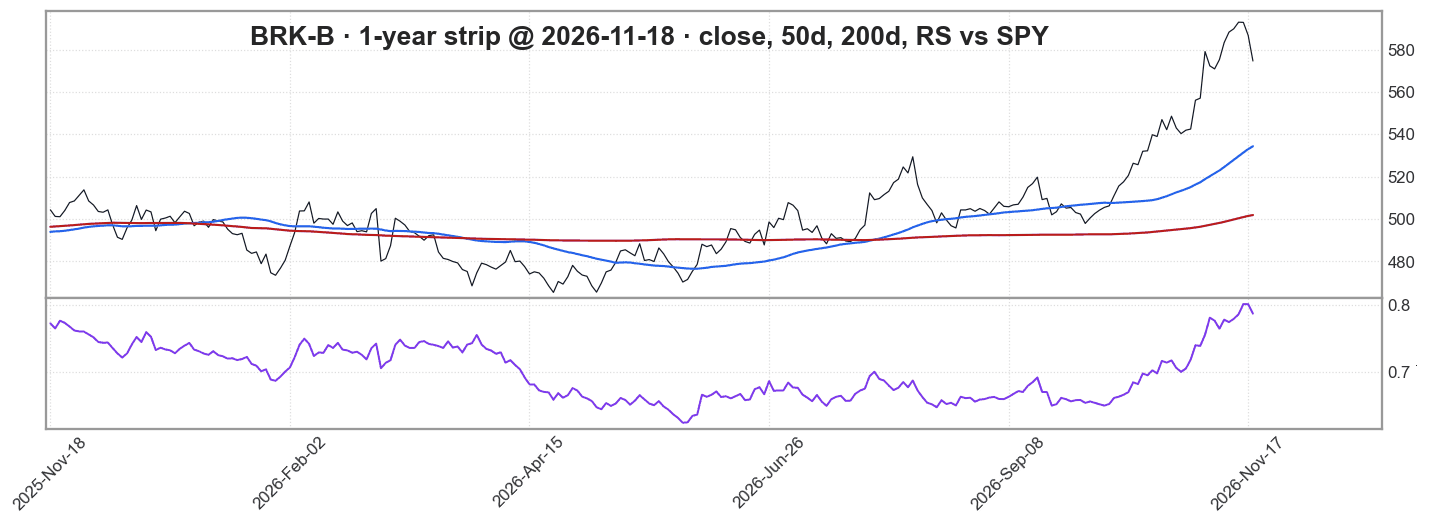
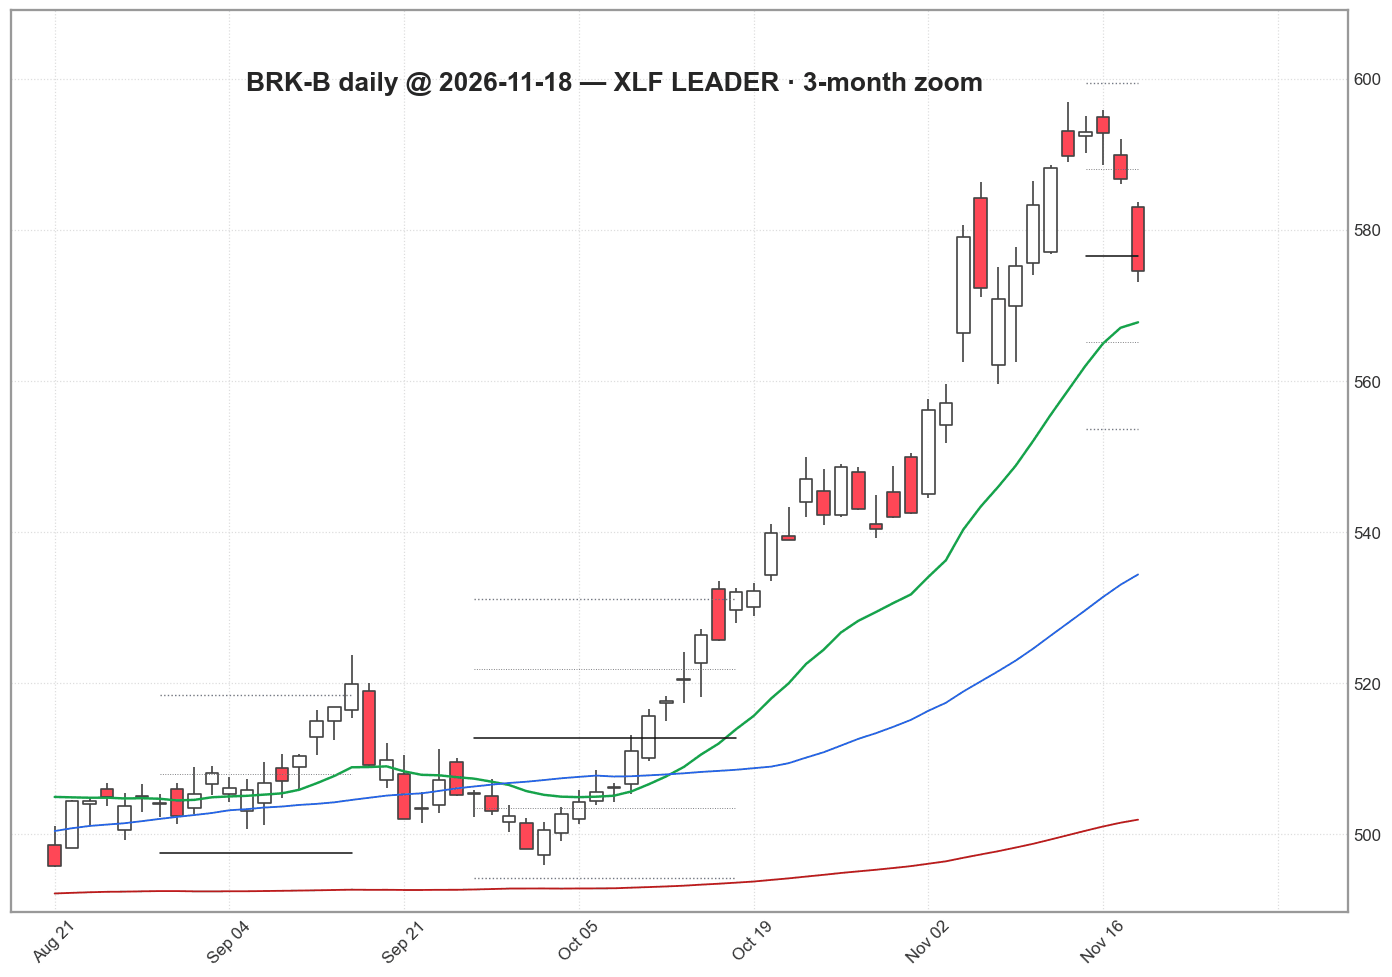
| Sector | XLF · Financials |
|---|---|
| Sector quadrant | LEADING |
| 3M vs SPY | +23.4% |
| Sector breadth | 4/10 |
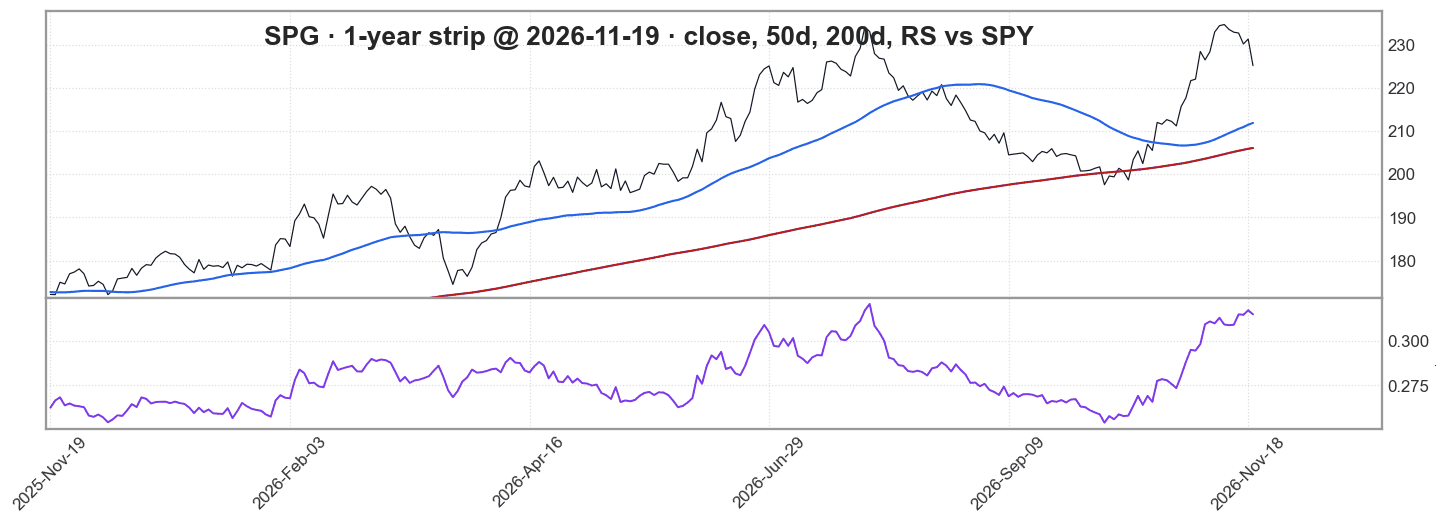
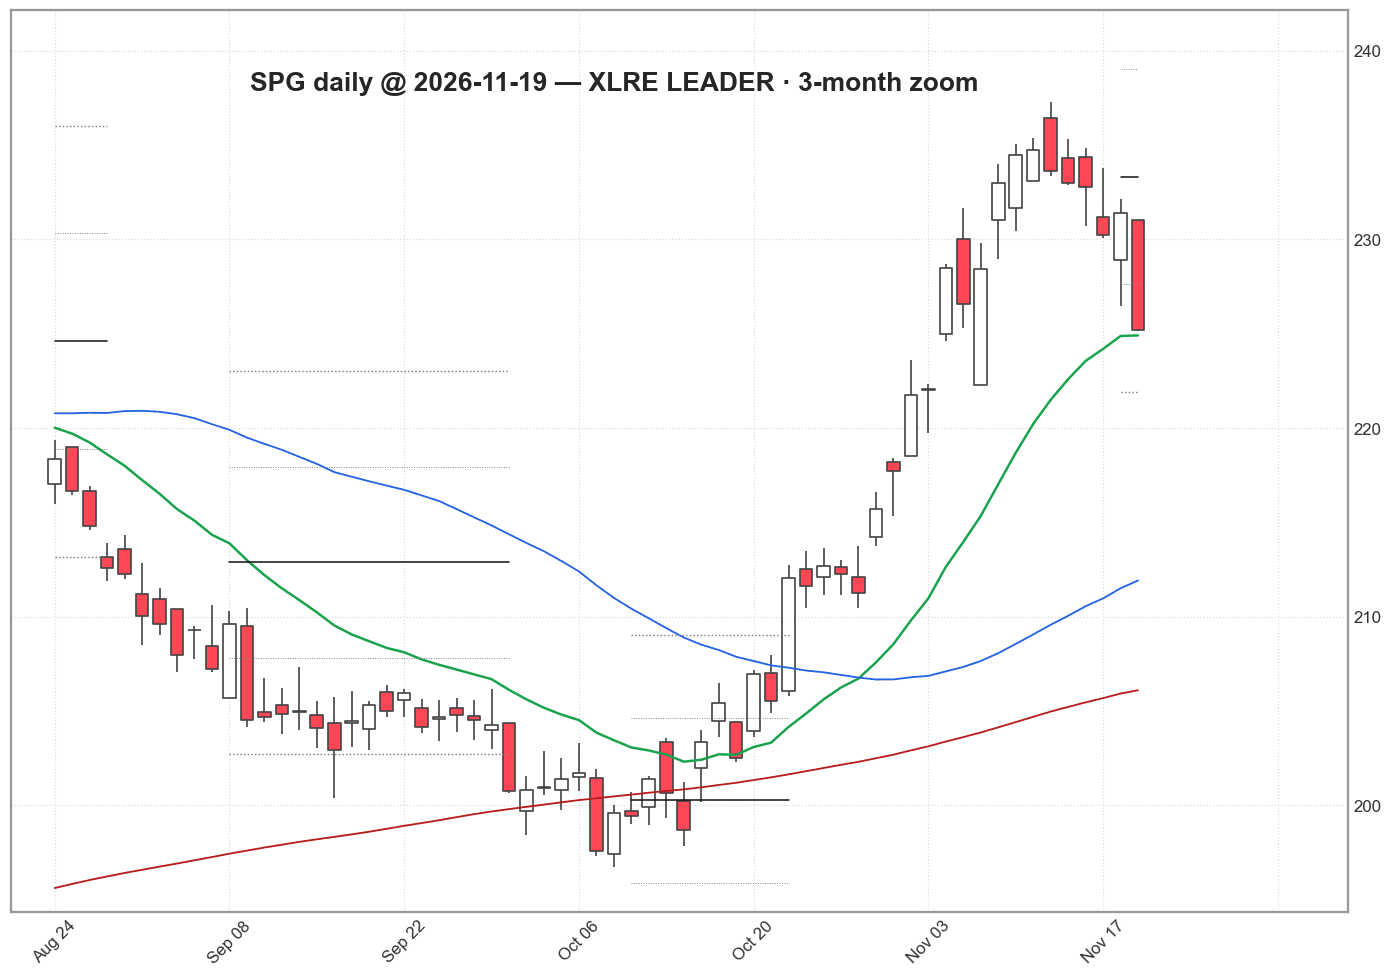
SPG · strongest of XLRE top holdings · 3M vs SPY +11.3%
price trend: strongPrices 2026-11-19Best 3-month relative strength among the top 10 holdings of XLRE (Real estate, currently leading). Holdings list as of 2026-08-06. Descriptive only. Source: holdings_cache.json (2026-08-06); Robinhood daily bars (Yahoo backup)
| Sector | XLRE · Real estate |
|---|---|
| Sector quadrant | LEADING |
| 3M vs SPY | +11.3% |
| Sector breadth | 6/10 |
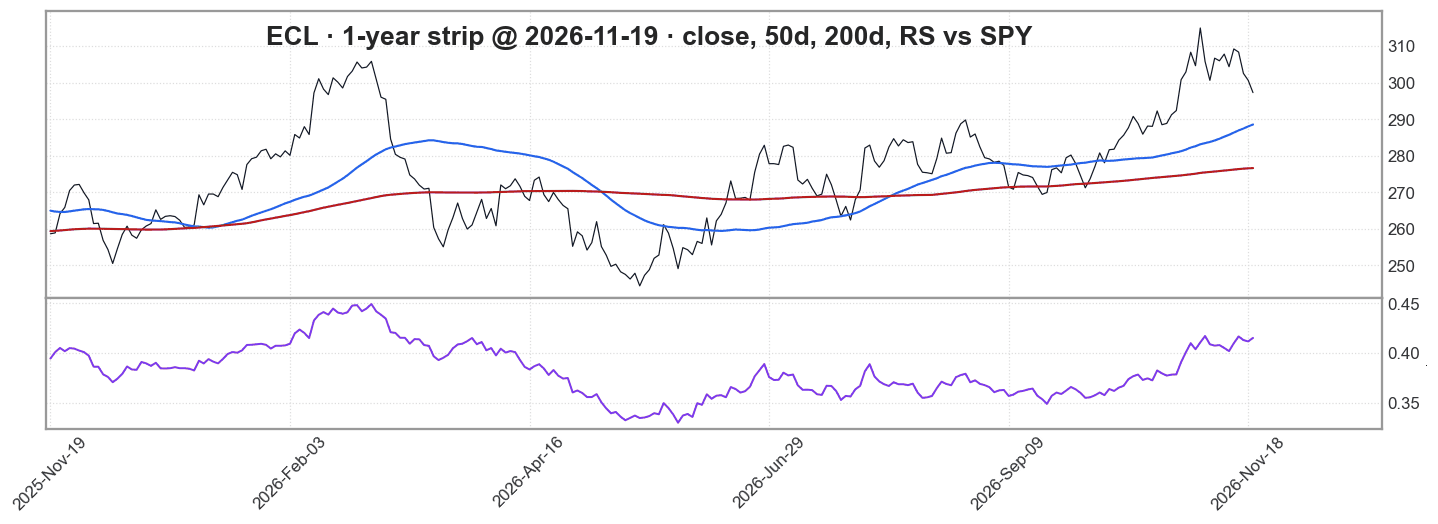
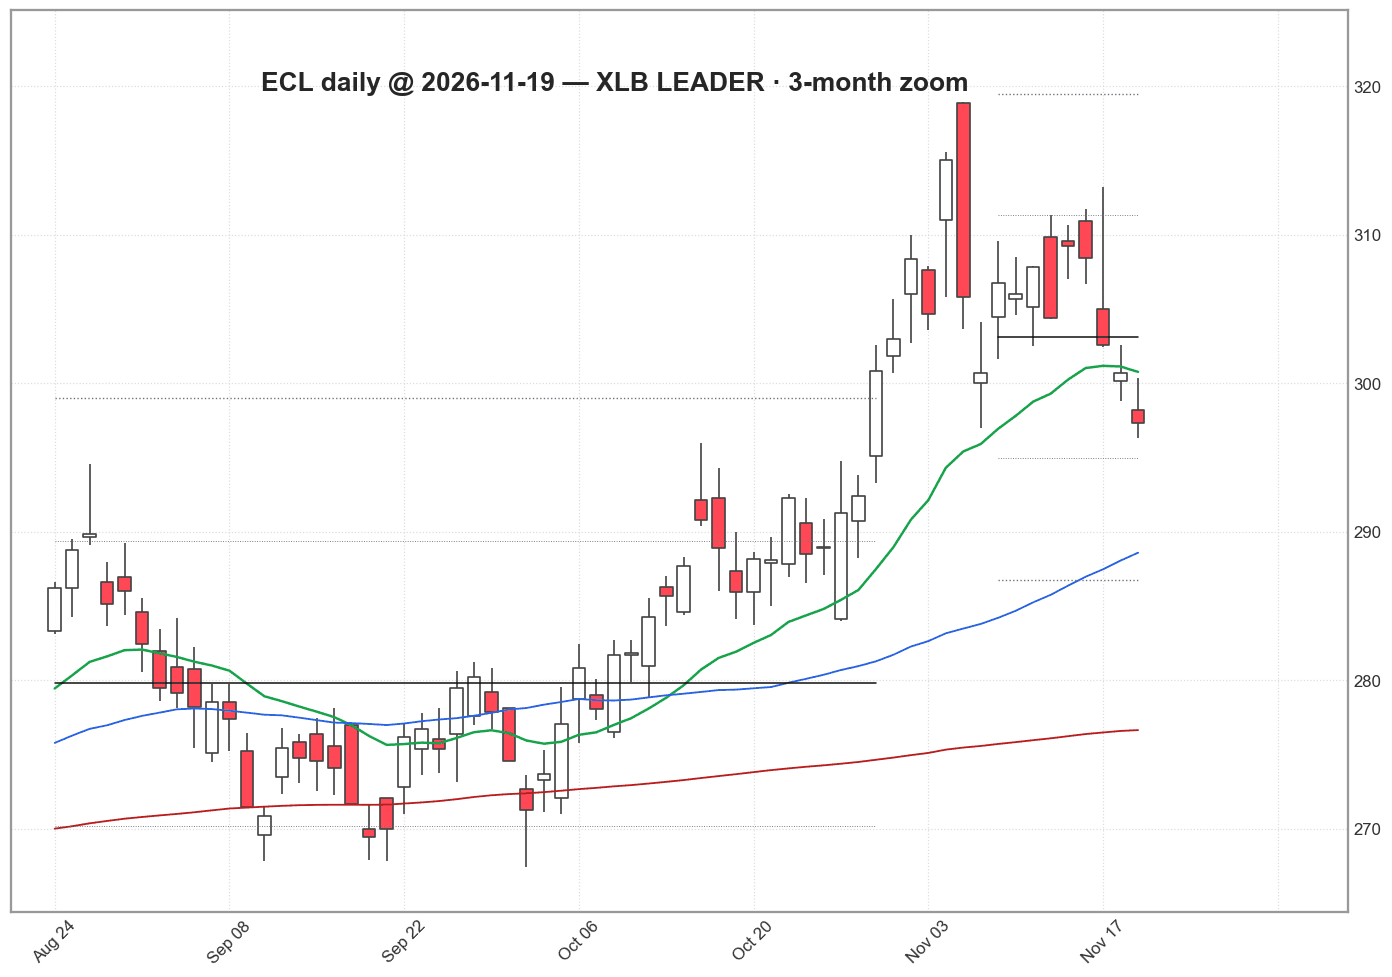
ECL · strongest of XLB top holdings · 3M vs SPY +12.9%
price trend: strongPrices 2026-11-19Best 3-month relative strength among the top 10 holdings of XLB (Materials, currently improving). Holdings list as of 2026-08-23. Descriptive only. Source: holdings_cache.json (2026-08-23); Robinhood daily bars (Yahoo backup)
| Sector | XLB · Materials |
|---|---|
| Sector quadrant | IMPROVING |
| 3M vs SPY | +12.9% |
| Sector breadth | 7/10 |
DIS · strongest of XLC top holdings · 3M vs SPY +19.0%
price trend: strongPrices 2026-11-19Best 3-month relative strength among the top 10 holdings of XLC (Communications, currently improving). Holdings list as of 2026-07-20. Descriptive only. Source: holdings_cache.json (2026-07-20); Robinhood daily bars (Yahoo backup)
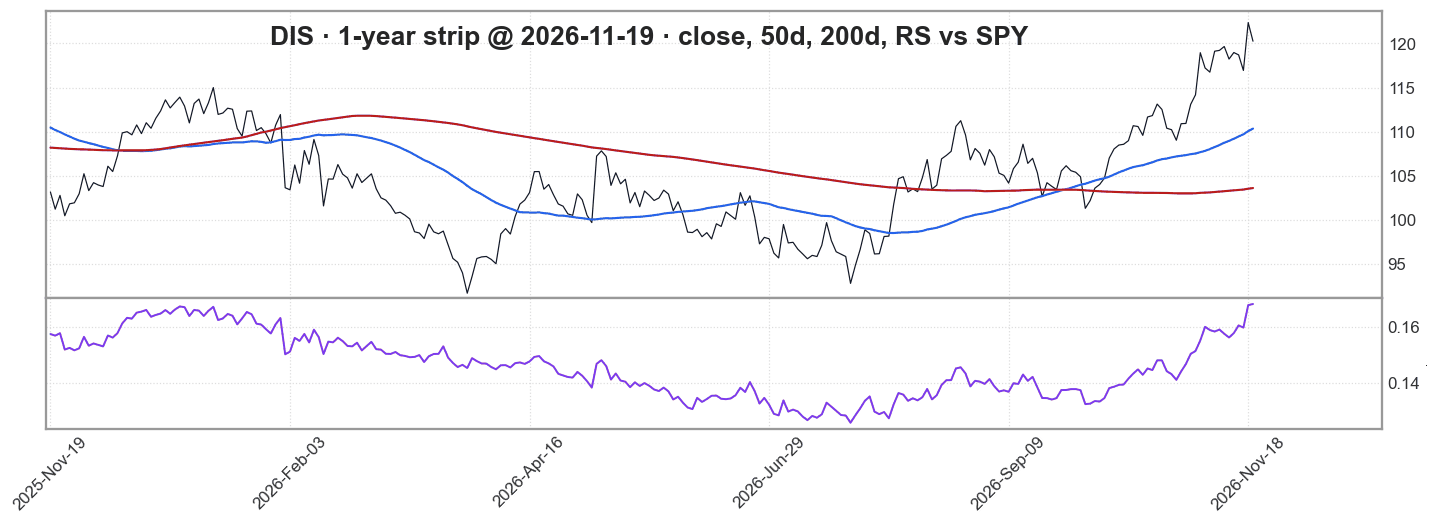
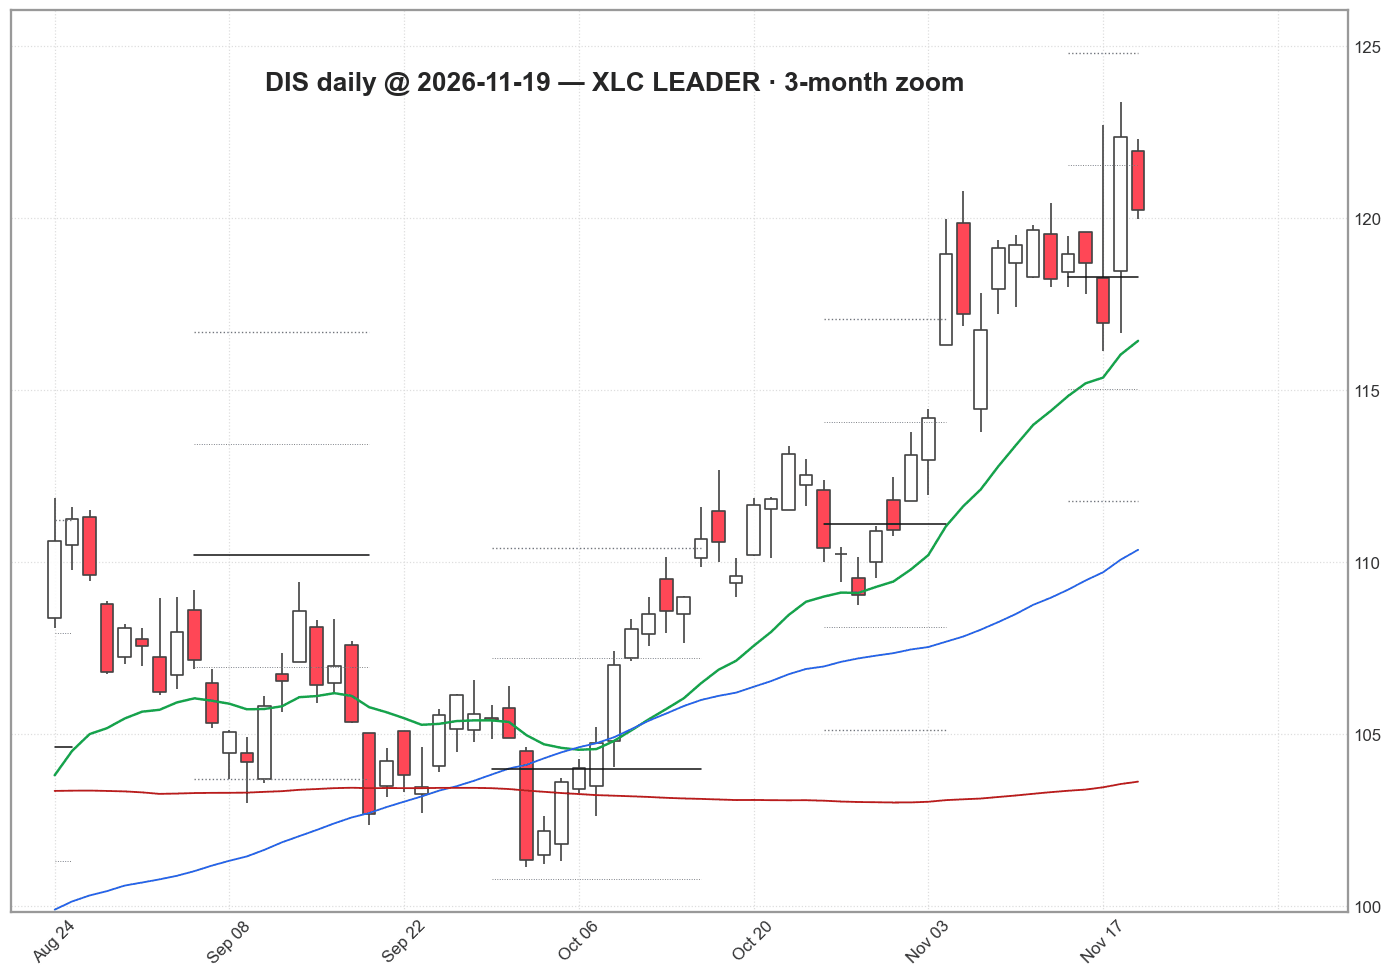
| Sector | XLC · Communications |
|---|---|
| Sector quadrant | IMPROVING |
| 3M vs SPY | +19.0% |
| Sector breadth | 3/8 |
DE · strongest of XLI top holdings · 3M vs SPY +3.2%
price trend: mixedPrices 2026-11-19Best 3-month relative strength among the top 10 holdings of XLI (Industrials, currently improving). Holdings list as of 2026-07-26. Descriptive only. Source: holdings_cache.json (2026-07-26); Robinhood daily bars (Yahoo backup)
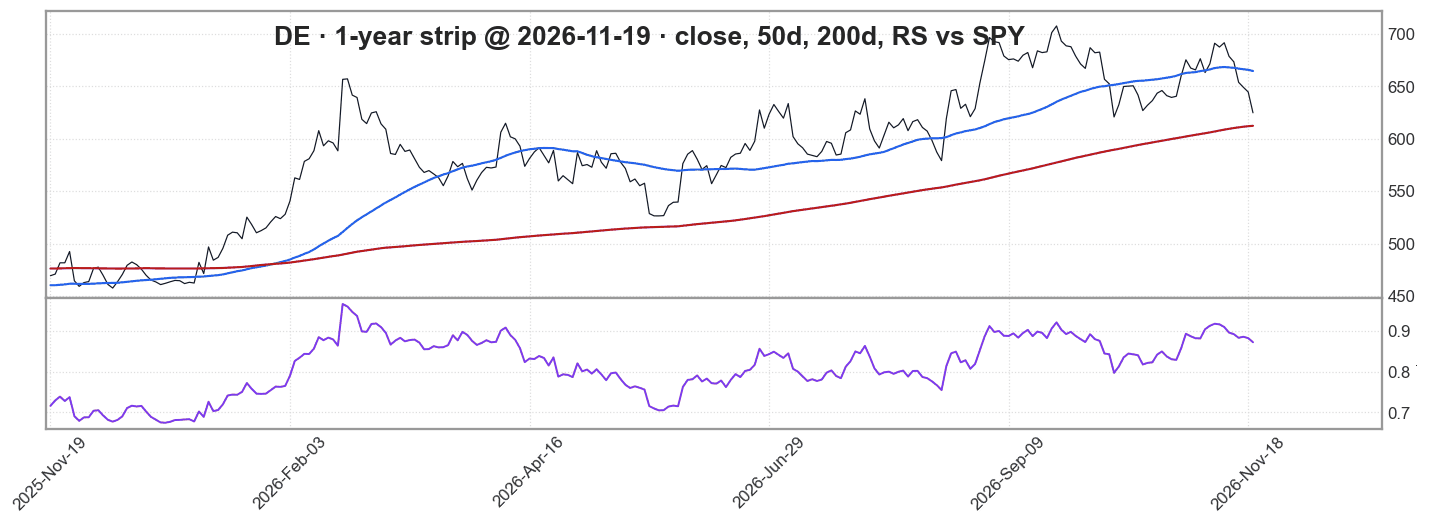
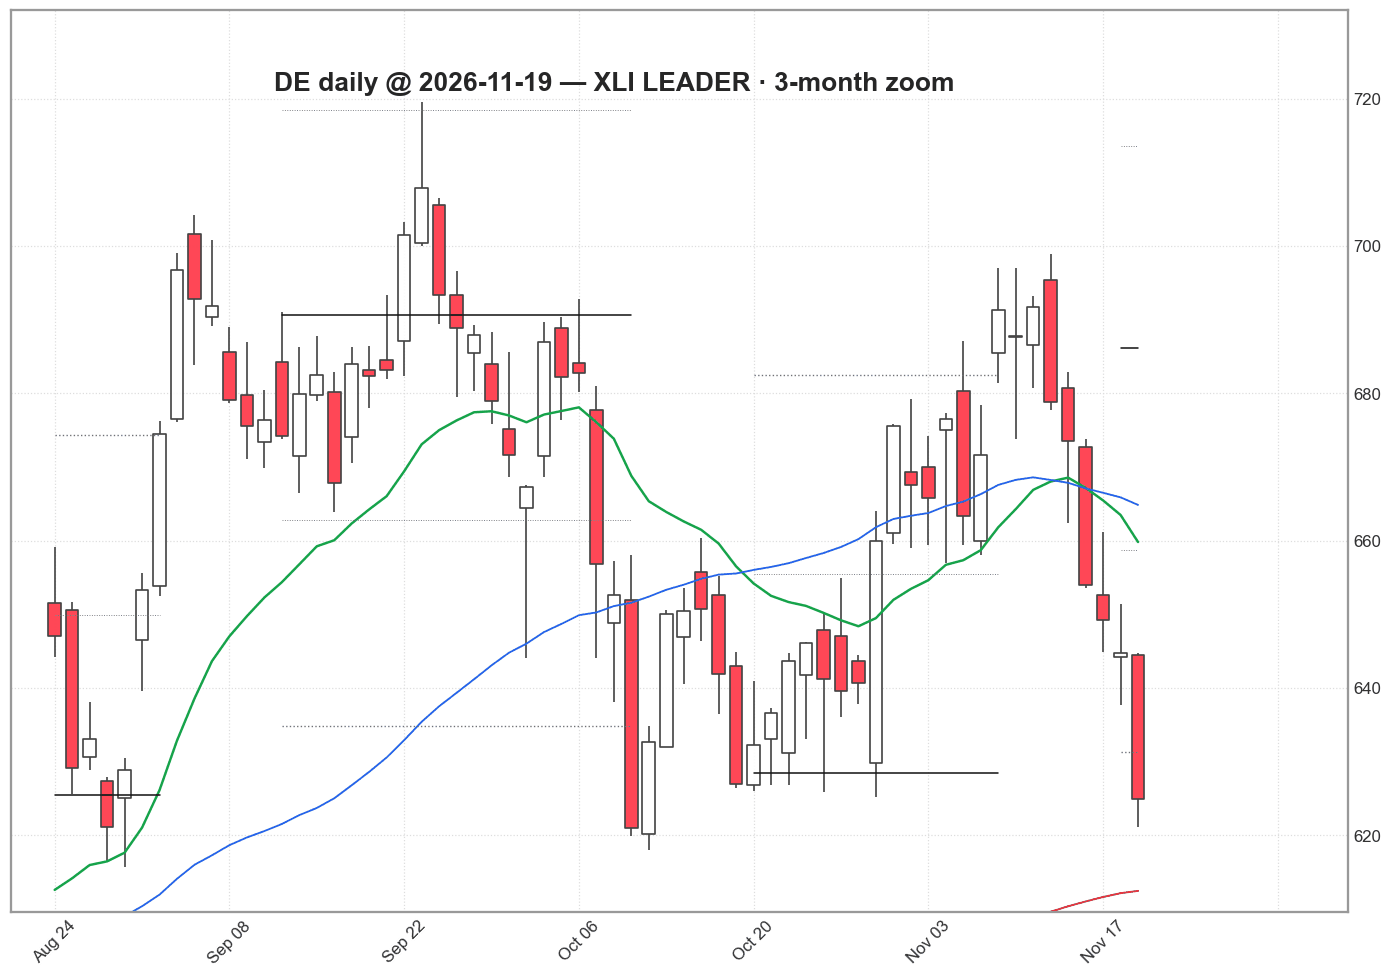
| Sector | XLI · Industrials |
|---|---|
| Sector quadrant | IMPROVING |
| 3M vs SPY | +3.2% |
| Sector breadth | 2/10 |
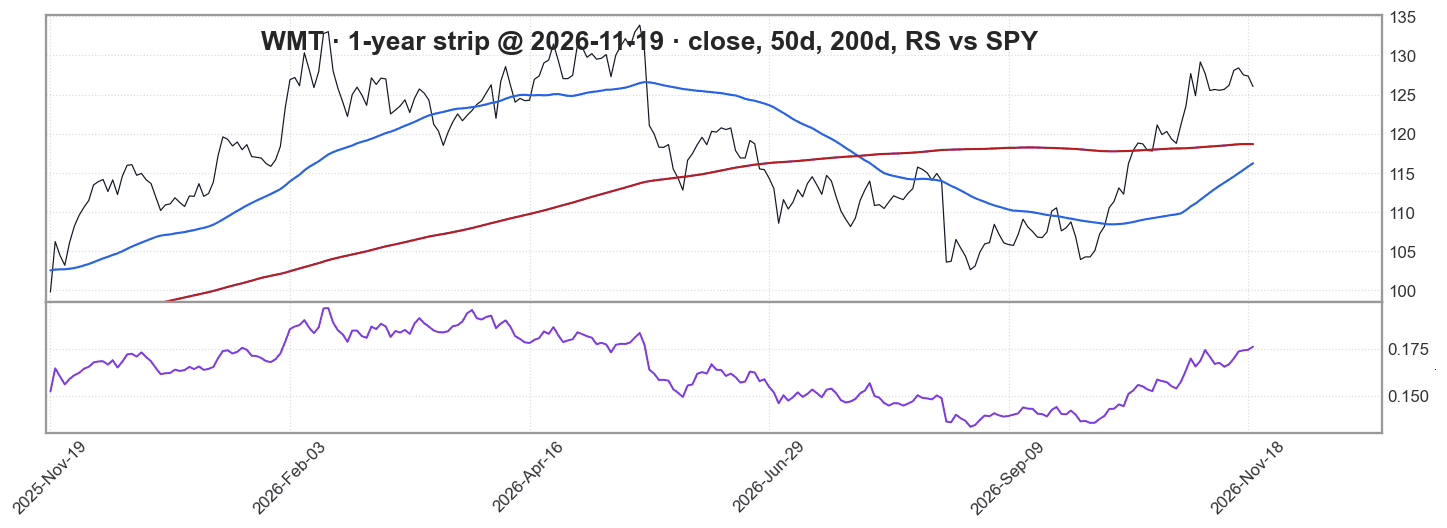
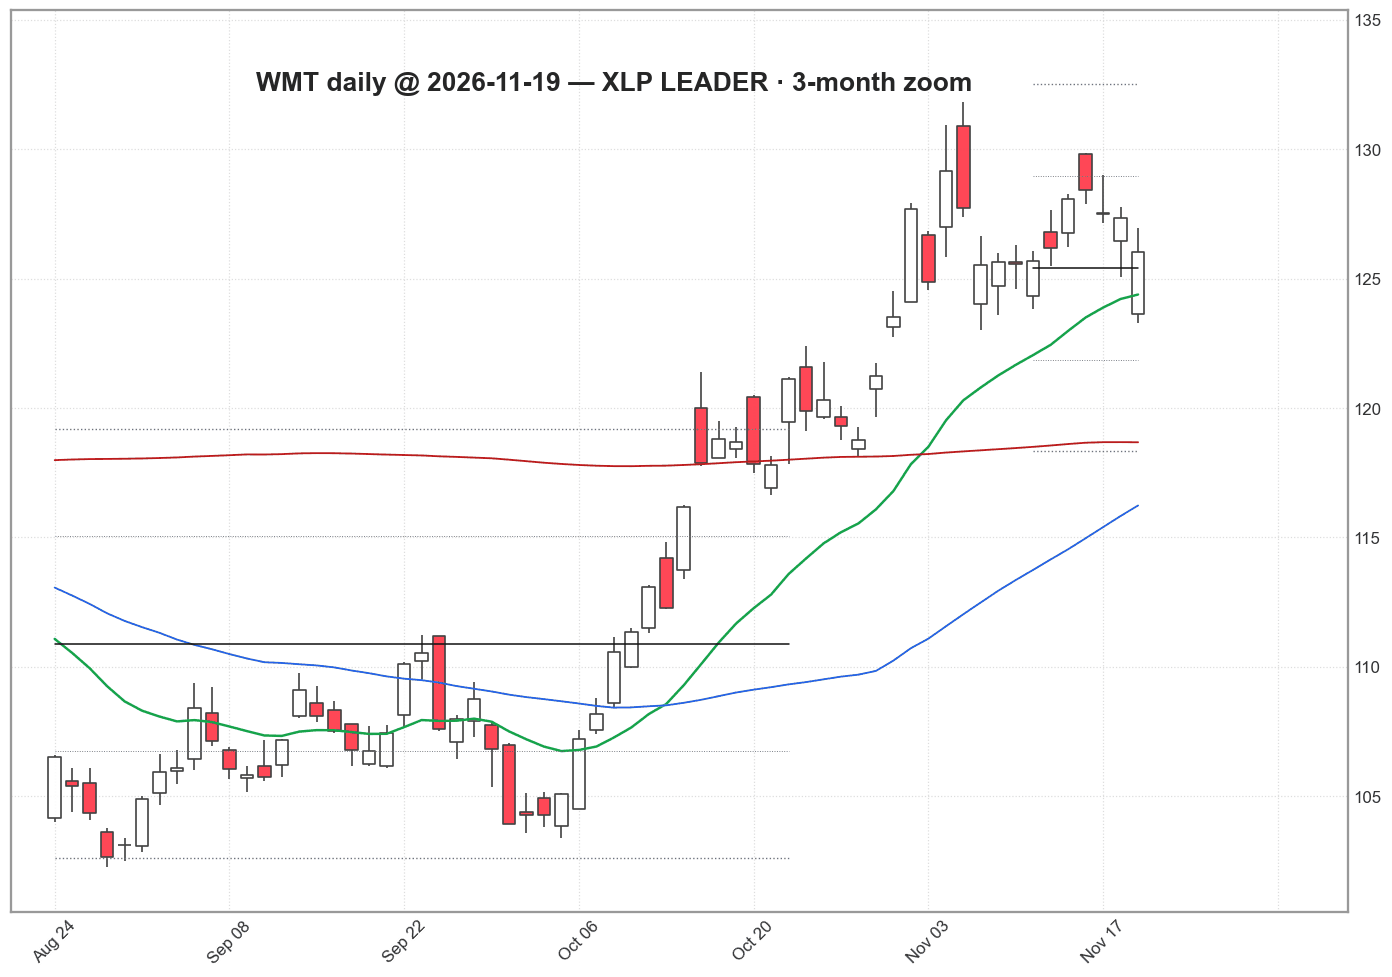
WMT · strongest of XLP top holdings · 3M vs SPY +29.7%
price trend: strongPrices 2026-11-19Best 3-month relative strength among the top 10 holdings of XLP (Staples, currently weakening). Holdings list as of 2026-08-06. Descriptive only. Source: holdings_cache.json (2026-08-06); Robinhood daily bars (Yahoo backup)
| Sector | XLP · Staples |
|---|---|
| Sector quadrant | WEAKENING |
| 3M vs SPY | +29.7% |
| Sector breadth | 9/10 |
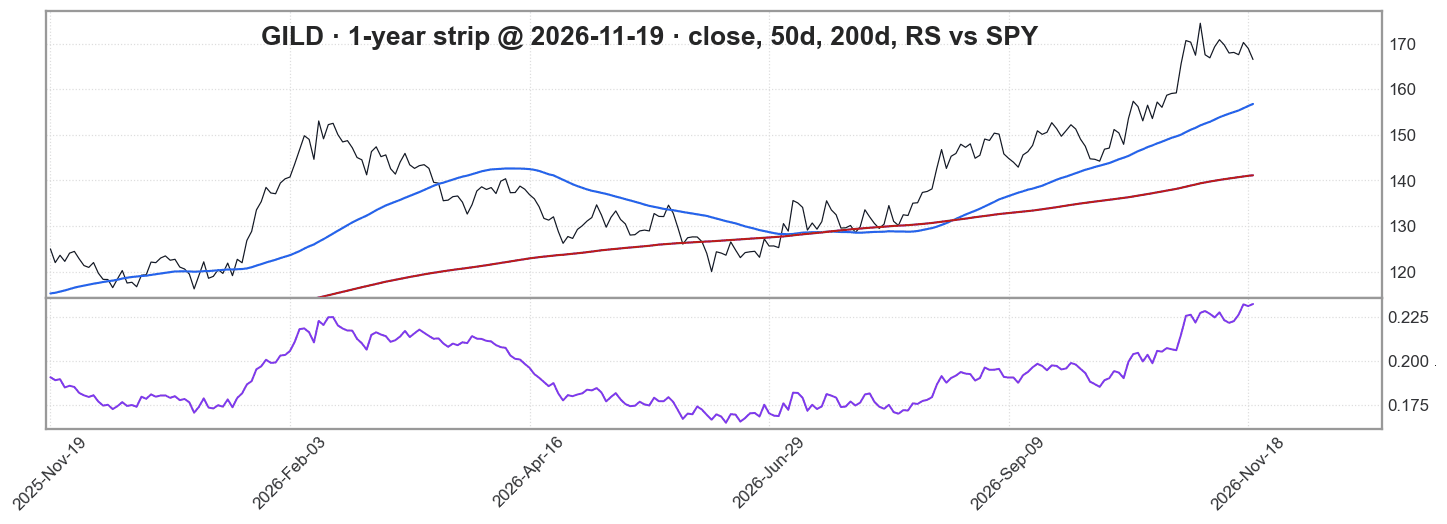
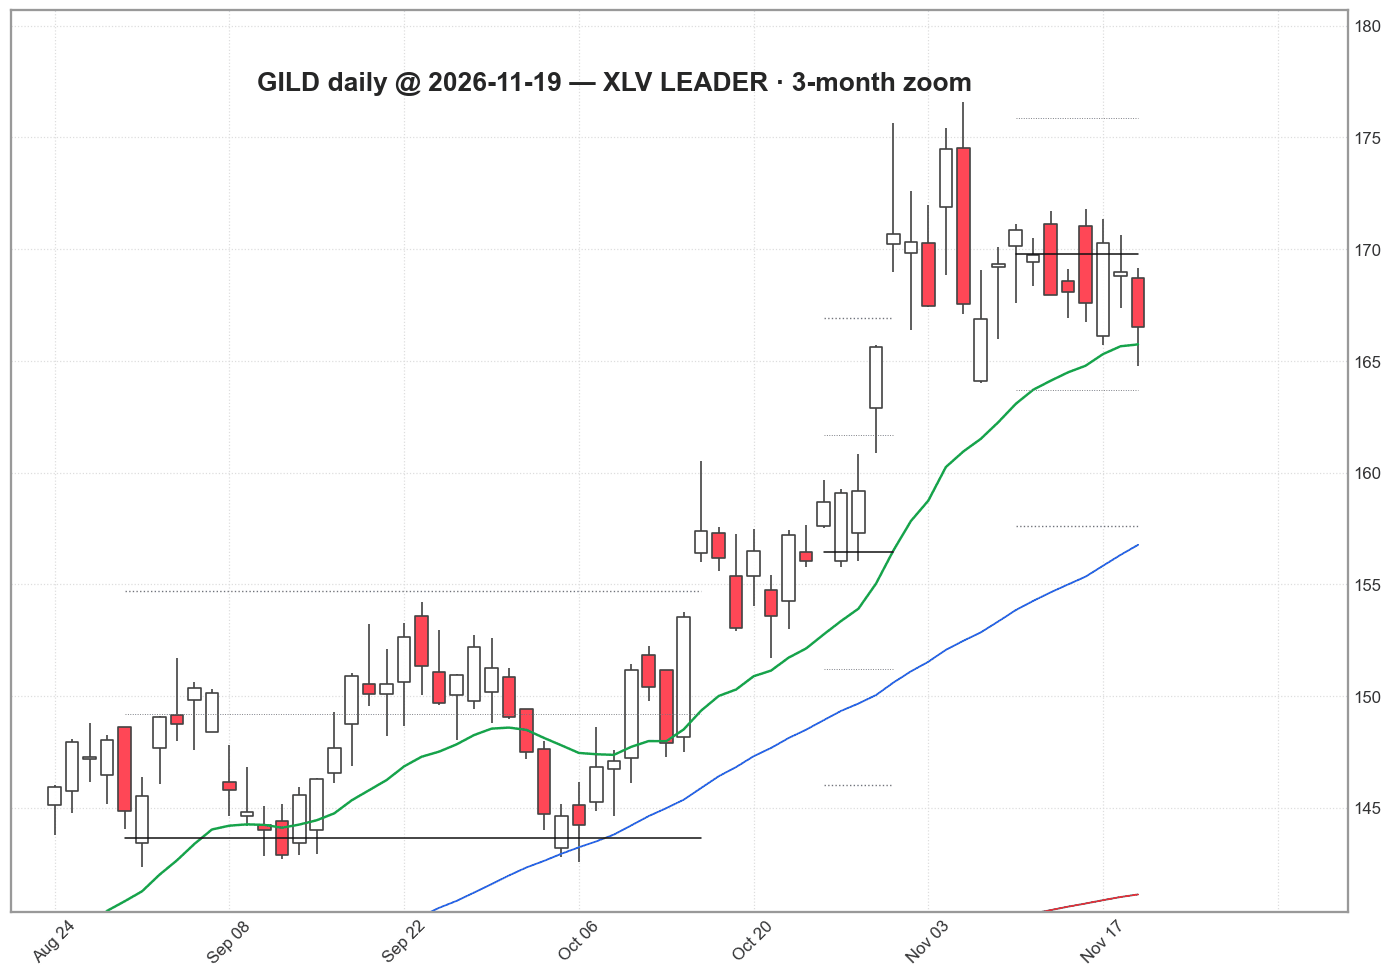
GILD · strongest of XLV top holdings · 3M vs SPY +22.3%
price trend: strongPrices 2026-11-19Best 3-month relative strength among the top 10 holdings of XLV (Health care, currently weakening). Holdings list as of 2026-08-23. Descriptive only. Source: holdings_cache.json (2026-08-23); Robinhood daily bars (Yahoo backup)
| Sector | XLV · Health care |
|---|---|
| Sector quadrant | WEAKENING |
| 3M vs SPY | +22.3% |
| Sector breadth | 7/10 |
MPC · strongest of XLE top holdings · 3M vs SPY +9.1%
price trend: mixedPrices 2026-11-19Best 3-month relative strength among the top 10 holdings of XLE (Energy, currently weakening). Holdings list as of 2026-08-23. Descriptive only. Source: holdings_cache.json (2026-08-23); Robinhood daily bars (Yahoo backup)
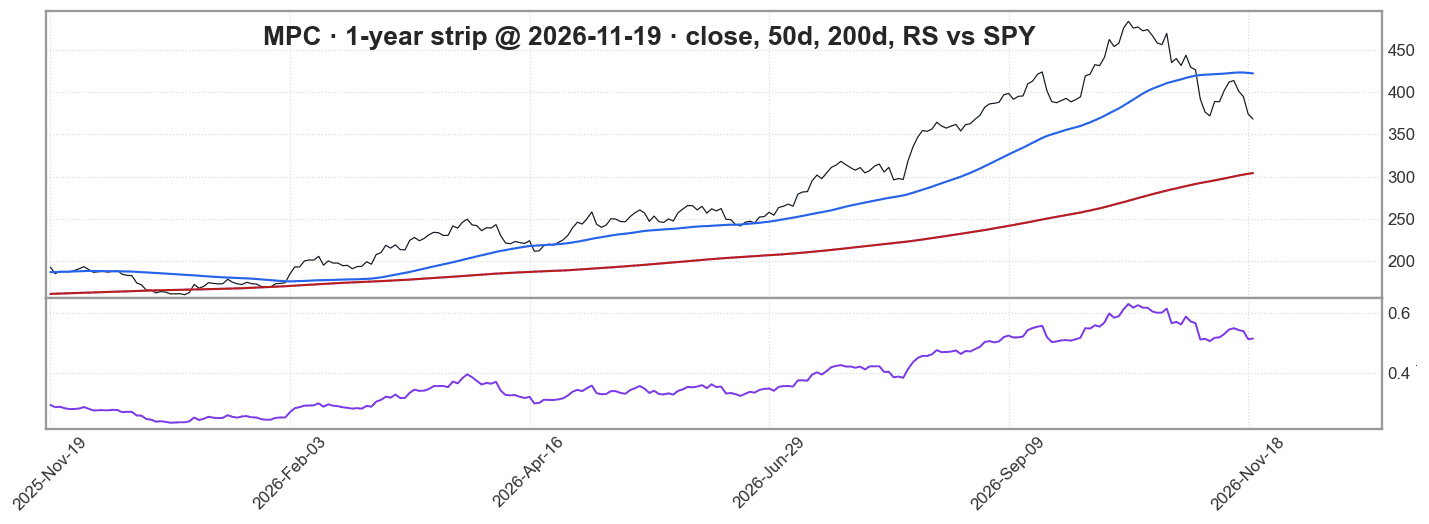
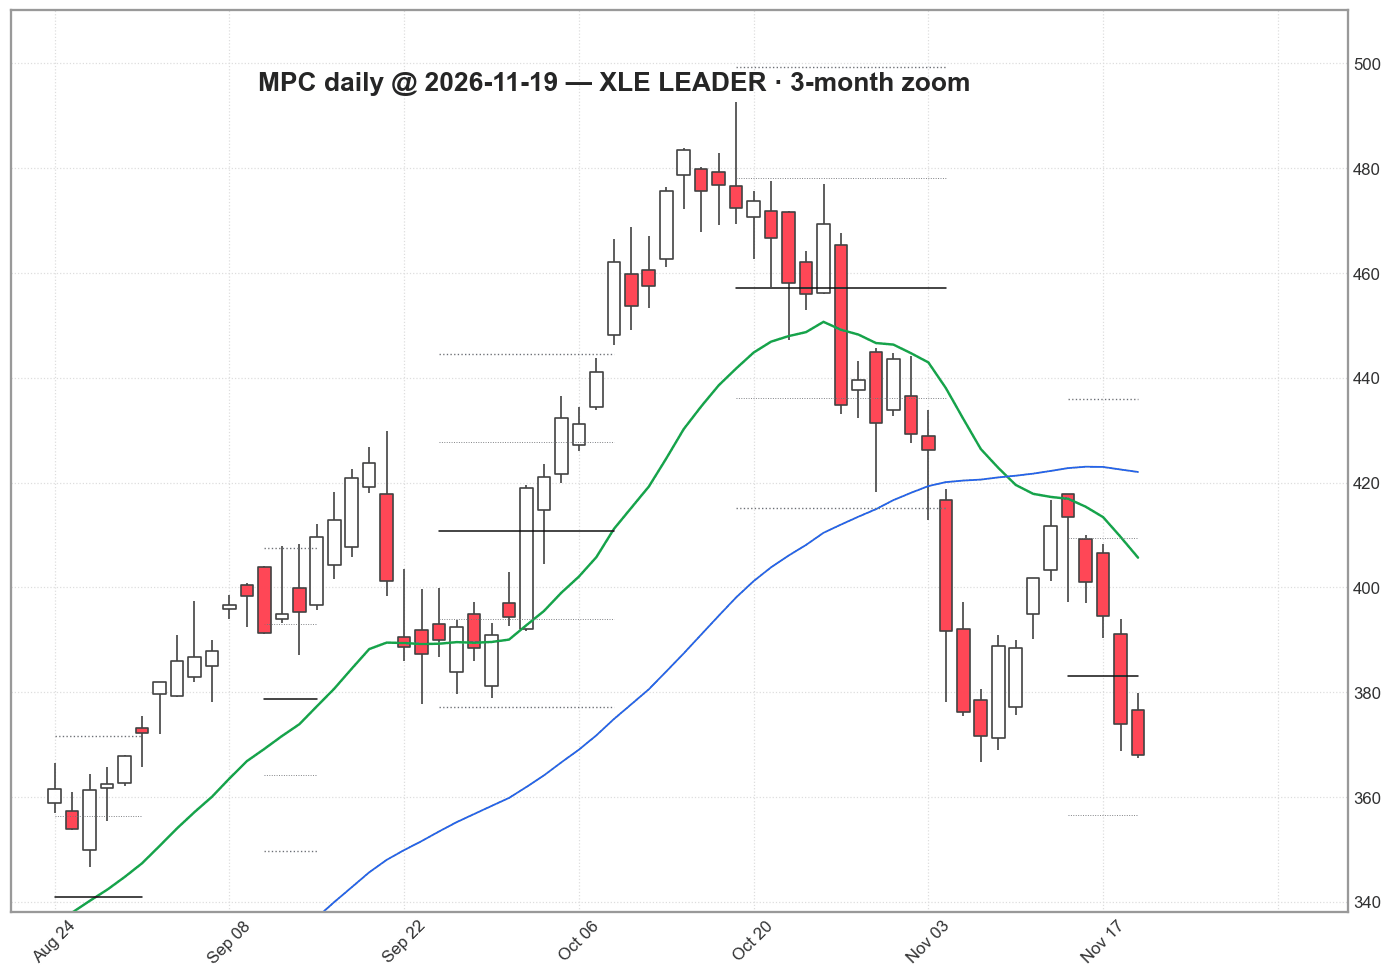
| Sector | XLE · Energy |
|---|---|
| Sector quadrant | WEAKENING |
| 3M vs SPY | +9.1% |
| Sector breadth | 9/10 |
AAPL · strongest of XLK top holdings · 3M vs SPY +20.5%
price trend: strongPrices 2026-11-19Best 3-month relative strength among the top 10 holdings of XLK (Technology, currently lagging). Holdings list as of 2026-08-23. Descriptive only. Source: holdings_cache.json (2026-08-23); Robinhood daily bars (Yahoo backup)
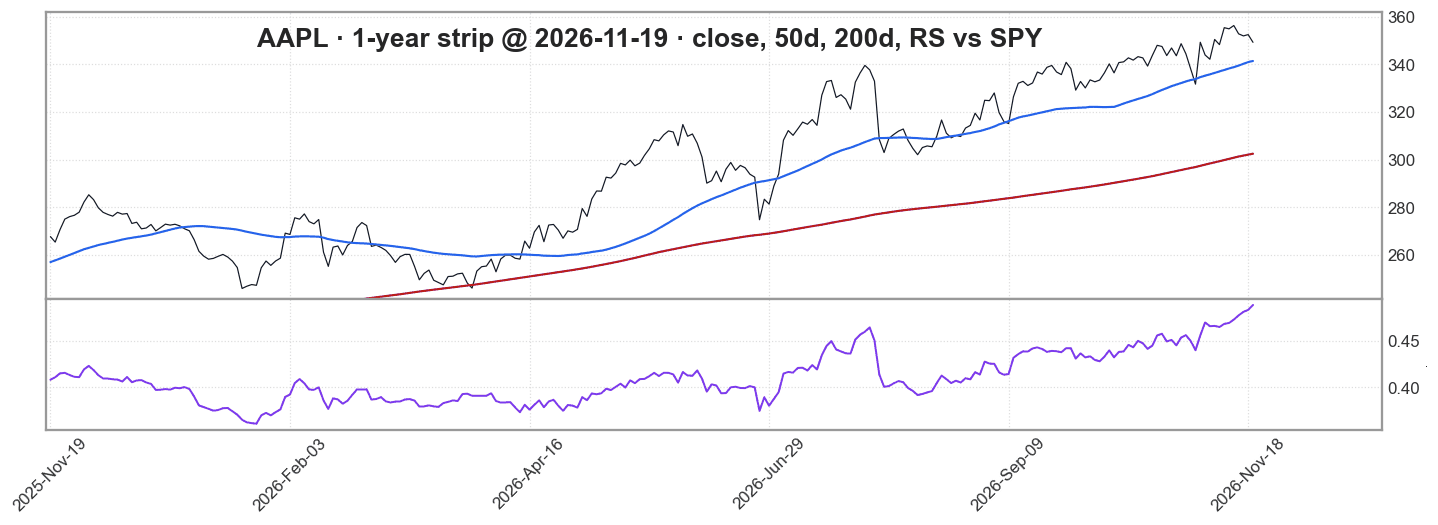
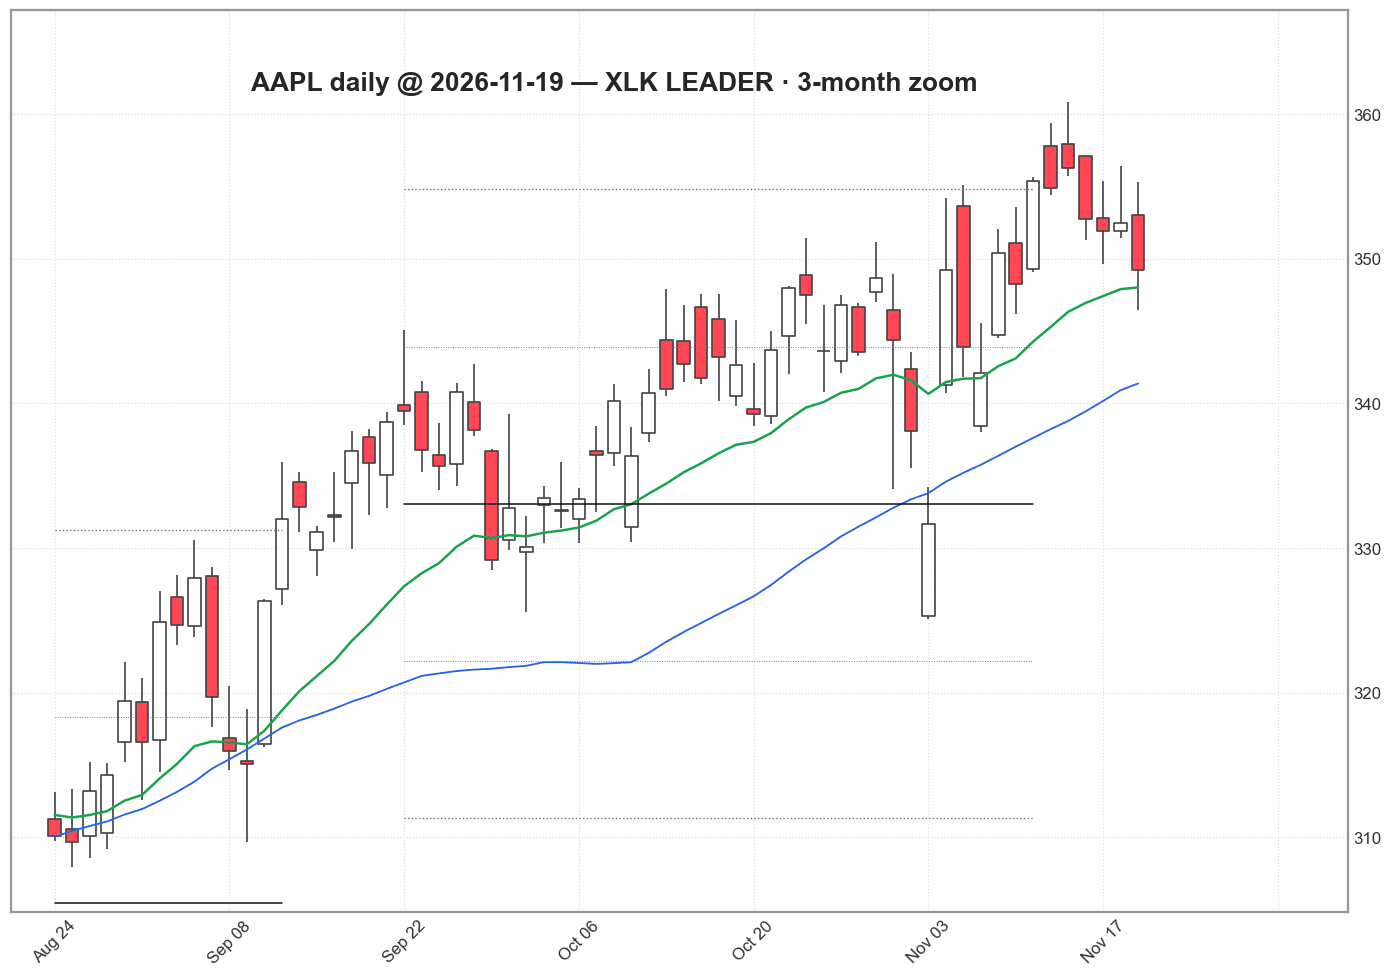
| Sector | XLK · Technology |
|---|---|
| Sector quadrant | LAGGING |
| 3M vs SPY | +20.5% |
| Sector breadth | 4/10 |
Price-trend badge: strong when the name beat the S&P 500 over both the last month and the last 3 months and closed above its 50-day average; weak when it trailed over both and closed below its 50-day average; otherwise mixed. This is not a service long or short.