Nov 19·prices through Nov 19·narrative & states as of Aug 6 / Aug 7
01
Invest lane: pullback ladders, catalysts, theses
Prices: Robinhood quotes, Nov 19, 3:20 PM CT (America/Chicago). A tier fires at its price level or on a one-day drop of its % from that session's prior close, whichever comes first. A price crossing is not an order or a fill. Percentages and public price levels only.
Auto-buy status override 2026-11-08 07:10 CT, source Invest. Owner-supplied live auto-buy status. Repo records were stale. Display only: no new trades, unpausing, or allocation changes.
Remainder flag: Spendable remainder is short of remaining allocations. Covers ~97% of BKNG remaining room.
Pullback ladders
Ticker
Ladder status
Price
Day
Tiers (level or one-day drop) · filled
Next tier
Gap to level
Drop-trigger price
Drop away
ASML
PAUSED since 2026-11-05 ~9:43 AM CT Trigger observed: 2026-11-05 prior close 1356.65 vs 1415 (tier B) Order submitted: no Fill confirmed: no Crossed while paused, not bought
$1,356.08
-2.8%
A: ≤$1,490.00 or −5% · filled B: ≤$1,415.00 or −10% · Crossed while paused, not bought C: ≤$1,335.00 or −15% · paused, not filled
B
-4.3%
$1,255.74
7.4%
META
PAUSED since 2026-11-05 Trigger observed: none recorded Order submitted: no Fill confirmed: no PAUSED since 2026-11-05 at owner's request. No order.
$596.24
-3.3%
1: ≤$590.00 or −7% · paused, not filled 2: ≤$545.00 or −12% · paused, not filled 3: ≤$500.00 or −15% · paused, not filled
1
1.1%
$573.23
3.9%
MA
PAUSED since 2026-11-05 Trigger observed: none recorded Order submitted: no Fill confirmed: no PAUSED since 2026-11-05 at owner's request. No order.
$626.76
-2.6%
1: ≤$560.00 or −7% · paused, not filled 2: ≤$530.00 or −12% · paused, not filled 3: ≤$500.00 or −15% · paused, not filled
1
10.7%
$598.33
4.5%
ASML: PAUSED since 2026-11-05 ~9:43 AM CT. Tier A filled Oct 30 (before pause). Tier B crossed by the Thu 11/05 close ($1,356.65 vs $1,415) while paused, not bought. Tier C paused, not filled. Customer interest in 2029–30 orders is not a signed order book. Demand exceeding planned 2027–28 supply is ASML's own Oct discussion, distinct from booked 2029–30 orders. Q3 FCF was lifted by customer down payments / prepayments (€3.6B → €9.3B). · META: PAUSED since 2026-11-05. Oct 22 earnings-reaction day skipped by rule. Do not auto-halve these prices on the 2027-01-19 Class C effective date; payment date and market adjustment are separate. · MA: PAUSED since 2026-11-05. Deepest-pullback ladder; Oct 29 earnings-reaction day skipped by rule.
BKNG — active strategy: LIVE 1% drop ladder
Active: bkng-1pct-drop-ladder-2026-11-05 · status LIVE. BKNG $147.32 (-3.9% on the day). LIVE 1% drop ladder, which replaced the $135/$125/$115 watch bands on 2026-11-05. Buys a fixed amount each time BKNG falls 1% below the last ladder fill, up to a cap. This page does not place or unpause orders.
Seed reference: $167.47 at 2026-11-05 12:39 PM CT (reference price, not a purchase).
When
Rungs
Avg fill
2026-11-06 9:08 AM CT
2 rungs
$163.39
2026-11-06 2:44 PM CT
1 rung
$161.53
Next trigger: $159.91. Cap used 15% · 85% remains.
Retired: bkng-watch-valuation-2026-10-28 ($135.00 / $125.00 / $115.00) marked RETIRED. Replaced by the LIVE 1% drop ladder on 2026-11-05.
Post-print 2026-11-03: adj EPS $4.66 vs ~$4.49; GAAP EPS $3.61; revenue $8.9B vs ~$9.54B. company release
2027 EPS estimate $12.37 remains the valuation basis for the retired $135/$125/$115 watch bands (10.9x / 10.1x / 9.3x). It is not Q3 quarterly EPS. Q3 2026 reported adjusted EPS $4.66 (GAAP $3.61) on 2026-11-03. The active strategy is the 1% drop ladder, not those bands.
Also watching: MCO $471.86 (-2.0%) · NVR $5,495.14 (-2.4%) · HOOD reviewed and passed.
Upcoming catalysts
When
Event
Consensus
Source
Jan 19, 2027 — Class C effective date (payment date TBD; not an automatic 2-for-1 of live ladder prices)
Meta Class C effective: 2-for-1 via Class C dividend (payment date TBD)
—
company-confirmed
Late Jan 2027
Meta and ASML Q4 results
—
estimated
Completed catalysts / results
When
Event
Consensus
Result
Source
Nov 3, 2026 (released)
BKNG Q3 results
was EPS ~$4.49 · revenue ~$9.55B
Adj EPS $4.66 vs ~$4.49; GAAP EPS $3.61; revenue $8.9B vs ~$9.54B; gross bookings $54.5B; room nights 345M
company-confirmed
Nov 4, 2026 (event date passed)
QCOM fiscal Q4 results
was EPS ~$2.16 · revenue ~$10.1B
Event date passed; print not loaded into this file.
company-confirmed
Week of Nov 9 (earliest pricing Nov 13)
Anthropic IPO roadshow
—
—
press-reported
Nov 17, after close (call 4:00 PM CT)
NVDA Q3 results
EPS ~$2.48 · revenue ~$108.9B
—
company-confirmed
Theses at a glance
Ticker
Fact
Analysis
META
Q3 ads +26%; FCF −$2.1B; S&P outlook cut to negative, AA- kept. Financing is both equity-like and bonds — see the Brief financing table. Do not treat $95B, $97.5B, or $37.5B as proceeds already received.
Drop auto-buy PAUSED since 2026-11-05. Ad growth is carrying the capex; negative FCF and rising debt are the risk. USD notes closed Nov 5; euro notes expected to settle Nov 12; mandatory convertible closed Oct 29; forward-sale proceeds arrive on settlement; Class C ATM is proposed only.
ASML
Q3 sales €11.7B; FCF €11.4B, lifted by customer down payments / prepayments (€3.6B → €9.3B). ASML discussed customer interest in 2029–30 orders and demand exceeding planned 2027–28 supply — interest and forecasts, not a signed 2029–30 order book.
Drop auto-buy PAUSED since 2026-11-05 ~9:43 AM CT. Thursday's close below $1,415 is a trigger observation, not a fill. Tier B: Crossed while paused, not bought.
MA
No tier filled yet; the Oct 29 earnings-reaction day was skipped by rule.
Drop auto-buy PAUSED since 2026-11-05. Quality compounder, bought only on the deepest pullbacks.
BKNG
Q3 printed Nov 3: adj EPS $4.66 vs ~$4.49, revenue $8.9B vs ~$9.54B. Active strategy is the LIVE 1% drop ladder (seed $167.47 on 2026-11-05; fills 2026-11-06). Next trigger $159.91. 15% of cap used, 85% remains.
The $135/$125/$115 watch bands are retired, replaced 2026-11-05. Mixed print (EPS beat, revenue miss) does not change the live ladder.
Rules-based levels for a long-term buy list, shown for reference; not advice. This page does not place, pause, or unpause orders. Financing detail is on the Brief, not this public lane.
02
AI themes dated 2026-11-01 — not this week
DATED
No newer Invest weekly handoff is on disk. The 2026-11-01 briefing is collapsed so a page rebuild cannot present it as current.
Open the 2026-11-01 briefing
The AI story is intact, but the market has switched from rewarding big AI spending to demanding cash returns. It is a rotation inside AI, not an exit.
META is holding up best. Neoclouds (CRWV, NBIS) and memory (SNDK, MU) are weakest even with record results.
Reporting interval: 2026-10-31 through 2026-11-01 (America/Chicago). Source briefing: From Invest's AI Weekend Deep Dive, Sat Oct 31. Ranking is Invest's analysis. Prices as of Oct 30.. This is not a live feed.
#
Theme
State
Tickers
What changed in that interval
1
AI that pays for itself (ads, cloud)
Strongest
META, AMZN, MSFT
META fell only 1.5% Friday vs QQQ −3.5%; Azure grew 48%
2
Big Tech AI spending / cloud demand
Demand strong, cash flow squeezed
GOOGL, AMZN, MSFT
Google: $51.4B Q3 spending, free cash flow −$9.1B; stock about −13% Oct 29
13 tickers named. Per theme: AI that pays for itself 3, Big Tech AI spending / cloud demand 3, Power for data centers 1, Memory chips 2, Chip equipment and AI chips 3, Neoclouds 2, AI lab IPOs 1.
That week
Friday Oct 30 was the worst day since June (QQQ −3.5%), set off by Intel's outlook.
Investors punished cash burn and debt-funded suppliers, even after record quarters.
Upcoming catalysts (authoritative record)
When
Event
Consensus
Source
Jan 19, 2027 — Class C effective date (payment date TBD; not an automatic 2-for-1 of live ladder prices)
Meta Class C effective: 2-for-1 via Class C dividend (payment date TBD)
—
company-confirmed
Late Jan 2027
Meta and ASML Q4 results
—
estimated
One event record across tabs. NVIDIA Q3 is 2026-11-17 in invest_lane/rules.json, not an unconfirmed ~Nov 18.
Completed catalysts / results
When
Event
Consensus
Result
Source
Nov 3, 2026 (released)
BKNG Q3 results
was EPS ~$4.49 · revenue ~$9.55B
Adj EPS $4.66 vs ~$4.49; GAAP EPS $3.61; revenue $8.9B vs ~$9.54B; gross bookings $54.5B; room nights 345M
company-confirmed
Nov 4, 2026 (event date passed)
QCOM fiscal Q4 results
was EPS ~$2.16 · revenue ~$10.1B
Event date passed; print not loaded into this file.
company-confirmed
Week of Nov 9 (earliest pricing Nov 13)
Anthropic IPO roadshow
—
—
press-reported
Nov 17, after close (call 4:00 PM CT)
NVDA Q3 results
EPS ~$2.48 · revenue ~$108.9B
—
company-confirmed
Handoff watch list as written on 2026-11-01 (not the live calendar)
Mon Nov 2: Palantir (PLTR) earnings
Tue Nov 3: AMD and Booking (BKNG) earnings
Early Nov: Memory contract prices (DRAM, NAND)
Nov 9–10 (approx.): Anthropic IPO price range
Tue Nov 10: CoreWeave (CRWV) earnings
All week: Fed speakers and odds of a December rate hike; whether META's Muse app stays in the top 5
~Nov 18: NVIDIA earnings (date not confirmed)
From Invest's AI Weekend Deep Dive, Sat Oct 31. Ranking is Invest's analysis. Prices as of Oct 30.
Current sourced observations lead. Capex growth is a company spending measure, not
automatic evidence of customer demand or profitable value capture. Stream units and periods are on each row.
Percentage changes from negative EPS or tiny bases are arithmetic, not a quality signal.
Fresh this build: prices through 2026-11-19 and the measured company streams
(fetched 2026-11-19).
Archive: failed gate-v1 research and frozen August 2026 classifications — not current validated judgments
Instrument unvalidated. Gate v2 has not passed. UNVALIDATED — not a current validated judgment. The promotion gate and these counts failed a placebo screen on 2026-08-06 (random baskets pass at the same rate). ESTABLISHED/EMERGING labels are frozen gate-v1 classifications as of 2026-08-07; gate v2 is designed but not approved or run and has not passed.
ESTABLISHED/EMERGING pills below are frozen gate-v1 labels as of 2026-08-07, not live promotions.
Frozen with dates: Grok narrative 2026-08-06, states 2026-08-07, overlap 2026-08-06,
incubator 2026-08-07.
03
Theme map (frozen overlap)
archive
6 themes · 5.57 effective. Edge width is measured
ticker overlap (Jaccard) of the named companies. Only 2 pairs share any company — the other
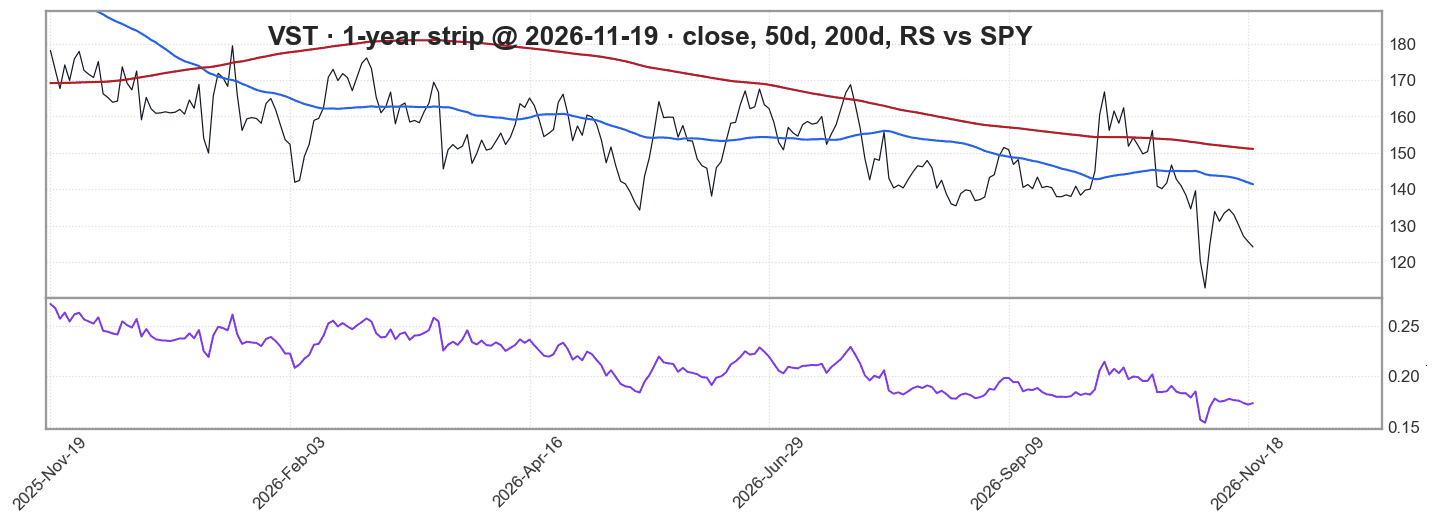
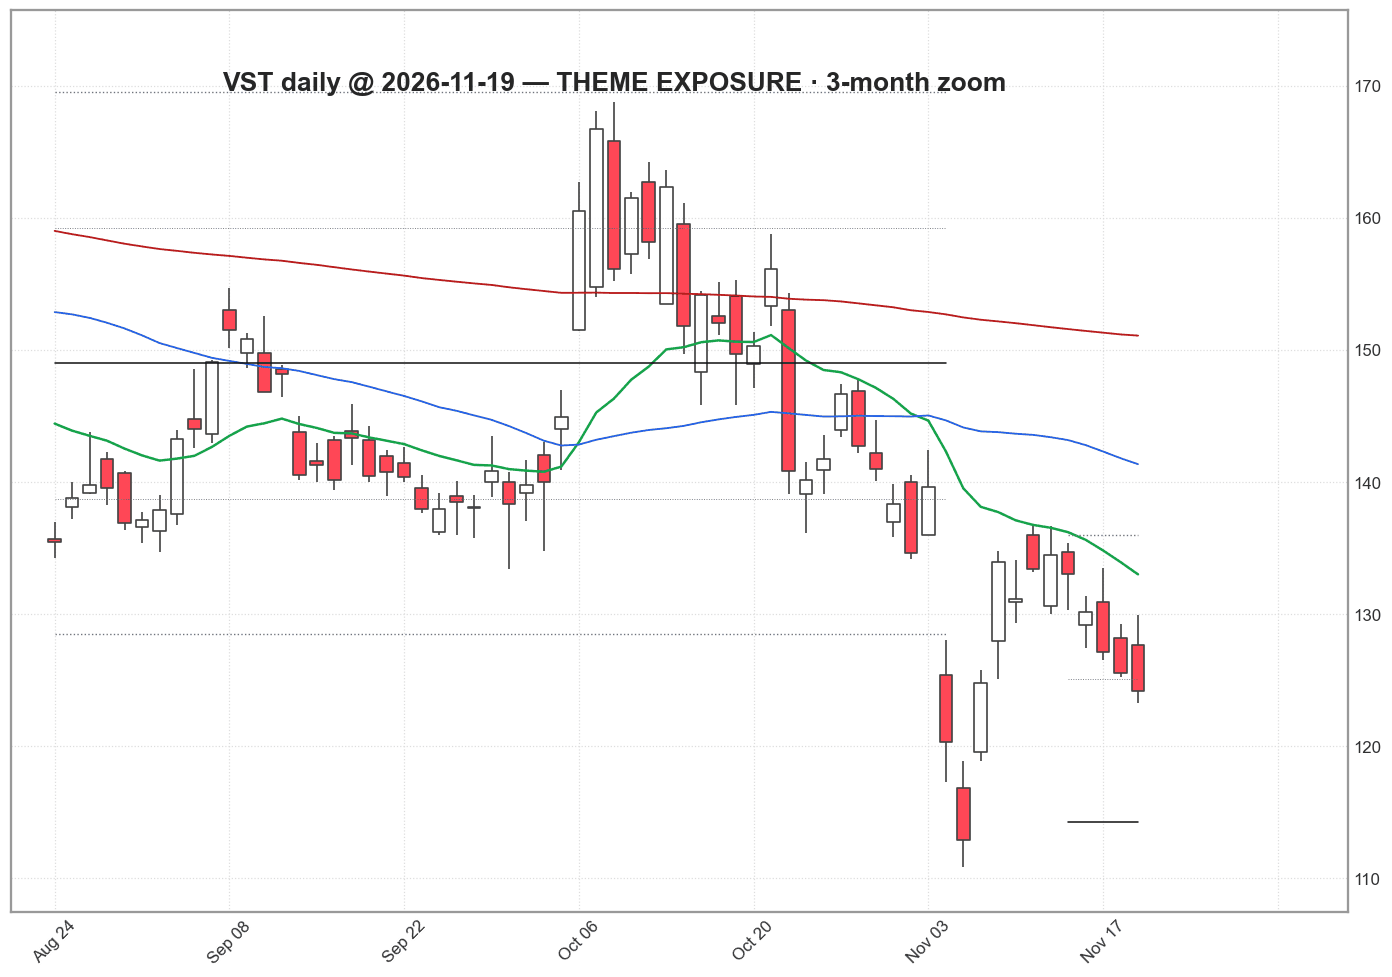
3 themes are unconnected in the data, so no hub is drawn. Shared names: AI Power Bottleneck – Grid Equipment Crunch 0.43 (ETN GEV PWR) · AI Power Bottleneck – Nuclear for AI 0.22 (CEG VST). State labels are as of 2026-08-07
and were assigned under gate v1 (see the red note above). Overlap as of 2026-08-06. Tap a theme to show its detail in section 06.
04
Evidence heatmap
nominal & effective
Theme
measured — counts toward convergence
Narr. not counted
Lang. none
eff
Accounts capex YoY
Analyst complex est·rev·rat
Price 3m vs SPY
AI Power Bottleneck
▲ +114%08/06: +61%
▲ 3↑/0↓08/06: 2↑/0↓
▼ -9.1%08/06: -16.8%
▲
—
2/308/06: 2/3
Hyperscaler Capex Supercycle
▲ +140%08/06: +77%
— 1↑/1↓ conflict08/06: 2↑/1↓ conflict
— +0.6%08/06: -5.0%
▲
—
2/308/06: 2/3
Nuclear for AI
▲ +63%08/06: +50%
— 1↑/1↓ conflict08/06: 0↑/0↓
▼ -36.1%08/06: -27.4%
▲
—
2/308/06: 1/3
Grid Equipment Crunch
▲ +71%08/06: +45%
▲ 3↑/0↓08/06: 2↑/0↓
▼ -10.1%08/06: -8.4%
▲
—
2/308/06: 2/3
NATO Defense Re-armament
— +14%08/06: +15%
▲ 3↑/0↓08/06: 2↑/0↓
— +1.9%08/06: +7.4%
▲
—
1/308/06: 2/3
Copper Electrification Scarcity
▲ +45%08/06: +31%
▲ 2↑/0↓08/06: 2↑/0↓
▼ -30.4%08/06: +4.9%
▲
—
2/308/06: 3/3
Optical Networking for AI · frozen
▲ +59%as of 2026-08-07
▲ 3↑/0↓
▼ -7.7%
▲
—
gate 3/4
Big number = measured this build (prices through 2026-11-19); small grey number = the 2026-08-06 reading the
old page showed. Narrative is quarantined — it reads ▲ on every row because it proposed every row, and it
never enters a count. Effective collapses estimates, revisions and ratings into one analyst complex.
Language has no source and stays visible for that reason. The incubator row is frozen at its last observation.
The eff counts are UNVALIDATED — same thresholds as the gate that failed the placebo screen.
05
Narrative vs evidence
discrete counts
Filled dot = this build (prices through 2026-11-19); dashed ring = 2026-08-06; the grey arrow is how it moved.
Upper left is the interesting quadrant — measured streams agreeing while price disagrees. It is not a buy zone.
The vertical axis is a discrete count, not a blended strength score (amendment 2 bans a combined continuous axis).
Counts are UNVALIDATED (gate v1 failed its placebo screen).
06
Lifecycle
hash-chained · as of 2026-08-07
AI Power Bottleneck
ESTABLISHED
Hyperscaler Capex Supercycle
ESTABLISHED
1 correction
Nuclear for AI
EMERGING
1 correction
Grid Equipment Crunch
ESTABLISHED
1 correction
NATO Defense Re-armament
ESTABLISHED
1 correction
Copper Electrification Scarcity
ESTABLISHED
1 correction
Optical Networking for AI
FROZEN
One dot per chained observation. The chain has 1 weekly observation
(2026-08-07); no observation has been added since, because new states would be assigned by the gate that
failed its placebo screen. States are as of 2026-08-07 and UNVALIDATED; re-derivation waits for gate v2.
Five of the six carry an appended correction (amendment 5 relabelled week-1 states — the original labels remain in
the file). Chain 12 records · intact (verified this build).
07
Incubator pipeline
gated · frozen
Optical Networking for AIFROZEN
Week 1 · created 2026-08-07 ·
last observation 2026-08-07 · Relayed industry hypothesis (user supplied), originating from a public market commentary regarding AI optical networking. Massi did not review the ori…
FROZEN — INSTRUMENT INVALID
The hypothesis was not disproved. The instrument that would have judged it failed its own screen.
Resume condition: Re-evaluated under gate v2 only, and only after gate v2 passes its own two-tier placebo screen. No promotion may occur under gate v1 under any circumstance.
frozen pending gate v2 — no disposition is possible while the instrument is invalid. Incubator chain 8 records · intact
(verified this build). Frozen by ruling; nothing here is refreshed.
08
Theme detail
every theme
Pick a theme below (or tap it in the map, heatmap or lifecycle). Each has Summary, Evidence, Narrative,
Beneficiaries, Price and Invalidation; the incubating theme has its dependency graph.
AI Power BottleneckESTABLISHED
Why nowas of 2026-08-06
FERC in recent weeks ordered major grid operators including PJM onto 60-day clocks to overhaul large-load interconnection rules, queue management, and cost allocation specifically for AI data centers. PJM simultaneously advanced proposals allowing curtailment of new large loads like data centers during emergencies starting 2027, while multiple analyses this summer quantified 30-50% of planned 2026 AI data center capacity facing power-driven delays or cancellations amid 2,600 GW national queues and multi-year post-approval waits. Speed-to-power has shifted from planning risk to active project cancellations and regulatory intervention this quarter.
Why-now pass as of 2026-08-06.
Current consensusconsensus · 2026-08-06
AI growth is primarily a semiconductor and software story with power as a manageable secondary input that utilities and renewables will eventually supply.
Grok read of 2026-08-06. Evidence basis claimed: company guidance · earnings commentary · industry reporting · macro data · analyst notes · single-source risk none
What is changingas of 2026-08-06
Hyperscaler guidance and industry forecasts now explicitly cite multi-year interconnection queues, reserve-margin risks, and power shortages restricting 40% of projects by 2027; Gartner and BNEF sharply raised data-center demand projections (e.g., global power demand +27% in 2026 to 132 GW); onsite generation and direct PPAs proliferate; language in earnings and reports shifted from 'efficiency' to 'speed-to-power' as the commercial risk.
Consensus versus our assessmentdifferentiated
Now: The accounts and the tape disagree. Either early or wrong — not confirmation. The market may be pricing something the accounts do not yet show.
2026-08-06: The accounts and the tape disagree. Either early or wrong — not confirmation. The market may be pricing something the accounts do not yet show. — same fixed rule, applied to each date's measured streams. Rule outputs inherit the unvalidated thresholds.
Lifecycle
State ESTABLISHED · week 1 · first seen 2026-08-07 · 3 of 5 measured streams confirm — first observation, so this is a level, not a trend
As of 2026-08-07; UNVALIDATED (assigned under gate v1).
Source convergencefact · counts unvalidated
Stream
Now
2026-08-06
Unit
n
capex
114.5
61.4
median YoY %
n=6
estimates
4.12
2.41
median 90d EPS drift %
n=6
revisions
0.71
0.451
mean 30d breadth
n=6
ratings
2
1
net 90d up-down
n=4
price
-9.1
-16.8
median 3m rel to SPY %
n=6
Now = measured this build (prices through 2026-11-19). Nominal 4 of 5 · effective 2 of 3 (on 2026-08-06: 3 of 5 · 2 of 3). Contradicting now: price. Silent now: none. Counts UNVALIDATED.
Grok's weekly readone stream · 2026-08-06
Read of 2026-08-06 — not refreshed. Momentum strengthening · sentiment improving
Supporting
Gartner: data-center electricity to 565 TWh in 2026 (+26-27% YoY) with power security as the new battleground
BNEF and others revised US/global data-center load forecasts sharply higher (e.g., 106 GW by 2035, +36% in months); PJM/ERCOT reserve risks flagged
Hyperscalers reporting unfulfilled Azure backlogs and multi-GW nuclear/gas PPAs; onsite power expectations up 22% in surveys
Lead times for grid connections 4-7 years in hubs; interconnection queues >1,500 GW
Multiple 2026 reports confirm power as top barrier delaying/canceling ~30-50% of planned US data centers
Conflicting
Some efficiency gains and liquid cooling may moderate per-rack demand growth
Renewables + storage buildout continues and could ease regional constraints longer-term
Not all announced data-center capacity will materialize; demand forecasts have wide ranges (200-1,000+ TWh by 2030)
One retrieval process. Proposes and describes; never confirms. Stated confidence is not displayed — an unscored number is decoration.
Possible blind spotsas of 2026-08-06
Second-order inflation in industrial power prices crowding out other users
Permitting and skilled labor bottlenecks for generation/transmission longer than equipment lead times
Natural gas bridging role and associated methane/policy risks underappreciated
Regional winners (gas-rich US basins, nuclear fleets) vs. constrained Europe/Asia
Thermal management and power systems critical for high-density AI racks; liquid cooling expansion
direct
yes
Further liquid-cooling wins and acquisitions integrating offerings
Slower rack density growth or competition eroding margins
Pay attention here. Not buy this. The XS1 programme found no selection edge from naming names.
Price confirmationcurrent
Prices through 2026-11-19: median 3-month relative -9.1% · participation 0/6 beating SPY (on 2026-08-06: -16.8% · 1/6). Price confirms or challenges; it does not create the theme.
US data-center interconnection queues and transformer lead times fall below 18 months on average with no major project delays reported in H2 2026 utility/hyperscaler updates — check by 2026-12-31
Gartner/BNEF or equivalent cut 2027-2030 data-center power demand forecasts by >20% citing efficiency or demand destruction — check by 2027-06-30
Falsifiers as supplied on 2026-08-06. Nine of twelve original falsifiers failed mechanical resolvability; the repaired manifest is pre-seal and unsealed, so none is resolved here.
Hyperscaler Capex SupercycleESTABLISHED
Why nowas of 2026-08-06
Q2 2026 earnings from the Big 4 plus Oracle saw every hyperscaler raise rather than cut 2026 capex guidance, pushing consensus aggregates to $690-750 billion—up ~60-70% YoY and the third straight year of 60%+ growth. Meta guided $115-135B, Alphabet lifted to $175-185B range, Amazon reaffirmed ~$200B, and Microsoft tracked toward $120B+, confirming the supercycle is still accelerating into H2 rather than peaking. This week's post-earnings revisions lock in the step-function higher spend that was only guided directionally six months ago.
Why-now pass as of 2026-08-06.
Current consensusconsensus · 2026-08-06
AI capex is elevated but will normalize quickly as models improve efficiency and ROI is proven; spend is concentrated in GPUs.
Grok read of 2026-08-06. Evidence basis claimed: company guidance · earnings commentary · analyst notes · industry reporting · single-source risk none
What is changingas of 2026-08-06
2026 guidance from AMZN (~$200B), GOOGL ($175-185B), META ($115-135B), MSFT (>$120B FY), ORCL (~$50B) far exceeded prior consensus, totaling ~$635-750B (+60-70% YoY); ~75% AI-related; language shifted to multi-year backlogs and power-constrained fulfillment; Goldman and others model trillions cumulative through 2031.
Consensus versus our assessmentdifferentiated
Now: Partial support. Too early to treat as established.
2026-08-06: The accounts and the tape disagree. Either early or wrong — not confirmation. The market may be pricing something the accounts do not yet show. — same fixed rule, applied to each date's measured streams. Rule outputs inherit the unvalidated thresholds.
Lifecycle
State ESTABLISHED · week 1 · first seen 2026-08-07 · 3 of 5 measured streams confirm — first observation, so this is a level, not a trend
As of 2026-08-07; UNVALIDATED (assigned under gate v1).
Source convergencefact · counts unvalidated
Stream
Now
2026-08-06
Unit
n
capex
140.1
76.7
median YoY %
n=5
estimates
1.32
5.53
median 90d EPS drift %
n=5
revisions
0.625
0.413
mean 30d breadth
n=5
ratings
-5
-2
net 90d up-down
n=13
price
0.6
-5.0
median 3m rel to SPY %
n=5
Now = measured this build (prices through 2026-11-19). Nominal 2 of 5 · effective 2 of 3 (on 2026-08-06: 3 of 5 · 2 of 3). Contradicting now: ratings. Silent now: none. Counts UNVALIDATED.
Grok's weekly readone stream · 2026-08-06
Read of 2026-08-06 — not refreshed. Momentum strengthening · sentiment stable
Supporting
CreditSights and others raised 2026 top-5 estimates to ~$750B from ~$600B earlier
Custom ASICs, networking, and AI connectivity benefiting from diversified hyperscaler spend
direct
yes
Additional custom silicon design wins and optics demand
Hyperscaler in-housing of more networking functions
Pay attention here. Not buy this. The XS1 programme found no selection edge from naming names.
Price confirmationcurrent
Prices through 2026-11-19: median 3-month relative +0.6% · participation 3/5 beating SPY (on 2026-08-06: -5.0% · 2/5). Price confirms or challenges; it does not create the theme.
Aggregate top-5 hyperscaler 2027 capex guidance comes in flat or down YoY versus 2026 levels in next earnings cycle — check by 2027-02-28
Major hyperscalers collectively announce >20% cuts to previously guided multi-year AI infra commitments — check by 2026-12-31
Falsifiers as supplied on 2026-08-06. Nine of twelve original falsifiers failed mechanical resolvability; the repaired manifest is pre-seal and unsealed, so none is resolved here.
Nuclear for AIEMERGING
Why nowas of 2026-08-06
FERC granted a key waiver in early June 2026 allowing Constellation to transfer grid rights and accelerate the Three Mile Island/Crane restart for Microsoft to a 2027 target (from 2028). This follows Meta's January 2026 trio of deals (Vistra, TerraPower, Oklo) unlocking up to 6.6 GW and the broader past-year wave of >10 GW big-tech nuclear PPAs/SMR orders now moving into permitting and construction milestones. Regulatory clearance and timeline compression this summer turn prior announcements into near-term firm capacity.
Why-now pass as of 2026-08-06.
Current consensusconsensus · 2026-08-06
Nuclear is too slow, expensive, and regulated to matter for near-term AI power needs; renewables + storage dominate.
Grok read of 2026-08-06. Evidence basis claimed: company guidance · industry reporting · earnings commentary · price · single-source risk none
What is changingas of 2026-08-06
Wave of 2025-2026 deals: Meta with Vistra/Oklo/TerraPower/Constellation (up to 6.6+ GW), Amazon/Talen, Google/Kairos, Microsoft/Constellation restarts and Brookfield/Cameco fuel deals; language from 'explore' to firm PPAs, prepayments, and equity-like support for SMRs targeting 2030s; corporate offtake now seen as key enabler for financing.
Consensus versus our assessmentdifferentiated
Now: The accounts and the tape disagree. Either early or wrong — not confirmation. The market may be pricing something the accounts do not yet show.
2026-08-06: The measured evidence does not support the story as told. — same fixed rule, applied to each date's measured streams. Rule outputs inherit the unvalidated thresholds.
Lifecycle
State EMERGING · week 1 · first seen 2026-08-07 · 1 measured stream(s) confirm — first observation, no direction yet
As of 2026-08-07; UNVALIDATED (assigned under gate v1).
Source convergencefact · counts unvalidated
Stream
Now
2026-08-06
Unit
n
capex
63.1
50.2
median YoY %
n=5
estimates
-0.76
-1.03
median 90d EPS drift %
n=5
revisions
0.315
0.03
mean 30d breadth
n=5
ratings
-3
0
net 90d up-down
n=3
price
-36.1
-27.4
median 3m rel to SPY %
n=5
Now = measured this build (prices through 2026-11-19). Nominal 2 of 5 · effective 2 of 3 (on 2026-08-06: 1 of 5 · 1 of 3). Contradicting now: ratings, price. Silent now: none. Counts UNVALIDATED.
Grok's weekly readone stream · 2026-08-06
Read of 2026-08-06 — not refreshed. Momentum strengthening · sentiment improving
Supporting
Meta Jan 2026 announcements for existing plant support + advanced nuclear up to 6.6 GW by 2035
Amazon Talen 1.92 GW PPA and SMR exploration; Google Kairos 500 MW path; Microsoft Three Mile Island restart path
Uranium producer positioned for fuel demand from restarts, uprates, and new nuclear
second order
partly
Long-term utility/hyperscaler fuel contracts or supply tightness confirmation
Oversupply or slower nuclear buildout
Pay attention here. Not buy this. The XS1 programme found no selection edge from naming names.
Price confirmationcurrent
Prices through 2026-11-19: median 3-month relative -36.1% · participation 0/5 beating SPY (on 2026-08-06: -27.4% · 0/5). Price confirms or challenges; it does not create the theme.
No additional hyperscaler nuclear PPAs or SMR offtake announcements of >500 MW cumulative in the next 12 months — check by 2027-08-06
Major SMR project (Oklo/Meta or equivalent) formally delayed beyond 2032 or canceled — check by 2027-06-30
Falsifiers as supplied on 2026-08-06. Nine of twelve original falsifiers failed mechanical resolvability; the repaired manifest is pre-seal and unsealed, so none is resolved here.
Grid Equipment CrunchESTABLISHED
Why nowas of 2026-08-06
Reuters reported in July 2026 that generator step-up transformer lead times hit >160 weeks by Q1 2026 (vs 143 in 2024) with high-voltage breakers at 125 weeks, as data centers drive equipment demand share toward 40%. April 2026 Presidential Determination under the Defense Production Act formally declared domestic grid equipment capacity (transformers, switchgear, conductors) 'dangerously limited' and authorized Title III support. Prices up ~75% and four-year waits are now binding on 2026-27 projects rather than abstract forecasts.
Why-now pass as of 2026-08-06.
Current consensusconsensus · 2026-08-06
Equipment supply will ramp with demand; shortages are temporary cyclical issues.
Grok read of 2026-08-06. Evidence basis claimed: industry reporting · company guidance · earnings commentary · macro data · single-source risk none
What is changingas of 2026-08-06
Transformer lead times >160 weeks, circuit breakers 125 weeks; WoodMac and others note demand +119% since 2019 with capacity lag; 30-50% of 2026 US data centers at risk of delay/cancel due to transformers; data-center share of electrical equipment market potentially to 40%; utilities scrambling and diversifying (including imports); pricing up sharply.
Consensus versus our assessmentdifferentiated
Now: The accounts and the tape disagree. Either early or wrong — not confirmation. The market may be pricing something the accounts do not yet show.
2026-08-06: The accounts and the tape disagree. Either early or wrong — not confirmation. The market may be pricing something the accounts do not yet show. — same fixed rule, applied to each date's measured streams. Rule outputs inherit the unvalidated thresholds.
Lifecycle
State ESTABLISHED · week 1 · first seen 2026-08-07 · 3 of 5 measured streams confirm — first observation, so this is a level, not a trend
As of 2026-08-07; UNVALIDATED (assigned under gate v1).
Source convergencefact · counts unvalidated
Stream
Now
2026-08-06
Unit
n
capex
71.3
44.9
median YoY %
n=4
estimates
4.12
3.95
median 90d EPS drift %
n=4
revisions
0.53
0.514
mean 30d breadth
n=4
ratings
3
1
net 90d up-down
n=3
price
-10.1
-8.4
median 3m rel to SPY %
n=4
Now = measured this build (prices through 2026-11-19). Nominal 4 of 5 · effective 2 of 3 (on 2026-08-06: 3 of 5 · 2 of 3). Contradicting now: price. Silent now: none. Counts UNVALIDATED.
Grok's weekly readone stream · 2026-08-06
Read of 2026-08-06 — not refreshed. Momentum strengthening · sentiment improving
Supporting
Reuters/Bloomberg 2026 reports: large power transformers most constrained; half of planned 2026 DCs delayed risk
Lead times extended significantly vs 2023-24; orders locked years forward
Eaton, Hubbell, GE Vernova (Prolec) citing data-center driven surges and backlogs equating to years of prior volume
Builds the connections and infrastructure that require the scarce equipment
second order
partly
Record awards continuing from utilities and DC developers
Project delays cascading from equipment shortages
Pay attention here. Not buy this. The XS1 programme found no selection edge from naming names.
Price confirmationcurrent
Prices through 2026-11-19: median 3-month relative -10.1% · participation 0/4 beating SPY (on 2026-08-06: -8.4% · 1/4). Price confirms or challenges; it does not create the theme.
Average US large power transformer lead times fall below 100 weeks and data-center delay reports drop sharply in industry surveys by end-2026 — check by 2026-12-31
Major manufacturers report declining orders or pricing pressure in electrical equipment for data centers/grid — check by 2027-03-31
Falsifiers as supplied on 2026-08-06. Nine of twelve original falsifiers failed mechanical resolvability; the repaired manifest is pre-seal and unsealed, so none is resolved here.
NATO Defense Re-armamentESTABLISHED
Why nowas of 2026-08-06
Allies are now submitting mid-2026 national roadmaps and concrete procurement plans to hit the Hague 5% GDP target (3.5% core + 1.5% security) by 2035, with the July 2026 Ankara summit shifting focus from pledges to implementation and industrial capacity. Germany’s November 2025-approved 2026 budget lifted Bundeswehr spending ~€20B YoY to €82.7B (total defense ~€108B with special fund); SIPRI April 2026 data showed European NATO 2025 spending up at the fastest rate since the early Cold War, with 22 allies already ≥2%. Contracts and budget executions are materializing this year.
Why-now pass as of 2026-08-06.
Current consensusconsensus · 2026-08-06
Post-Ukraine spending spike is temporary; fiscal constraints and US burden-sharing debates will cap European outlays.
Grok read of 2026-08-06. Evidence basis claimed: macro data · industry reporting · analyst notes · policy documents · single-source risk none
What is changingas of 2026-08-06
NATO Hague 2025 commitments to 3.5% core +1.5% broader by 2035; EU expenditure +8.6% to €454B in 2026 (75%+ vs 2021); Germany trajectory to €117B+ 2026 and higher; equipment share rising; US firms seeing $300B order book and 195k jobs from European buys; language from '2% aspiration' to binding multi-year plans and industrial strategy (EDIS, ReArm Europe).
Consensus versus our assessmentdifferentiated
Now: Partial support. Too early to treat as established.
2026-08-06: Partial support. Too early to treat as established. — same fixed rule, applied to each date's measured streams. Rule outputs inherit the unvalidated thresholds.
Lifecycle
State ESTABLISHED · week 1 · first seen 2026-08-07 · 3 of 5 measured streams confirm — first observation, so this is a level, not a trend
As of 2026-08-07; UNVALIDATED (assigned under gate v1).
Source convergencefact · counts unvalidated
Stream
Now
2026-08-06
Unit
n
capex
13.5
14.8
median YoY %
n=4
estimates
2.01
1.92
median 90d EPS drift %
n=4
revisions
0.593
0.852
mean 30d breadth
n=4
ratings
2
3
net 90d up-down
n=4
price
1.9
7.4
median 3m rel to SPY %
n=4
Now = measured this build (prices through 2026-11-19). Nominal 3 of 5 · effective 1 of 3 (on 2026-08-06: 3 of 5 · 2 of 3). Contradicting now: none. Silent now: none. Counts UNVALIDATED.
Grok's weekly readone stream · 2026-08-06
Read of 2026-08-06 — not refreshed. Momentum established · sentiment stable
Supporting
EU defense spend rising 11th consecutive year; 2026 estimate €454B / 2.4% GDP
NATO Europe equipment spend modeled +15% CAGR toward $340B by 2030
Germany, Nordics, Poland/Baltics leading with 3-4%+ trajectories; France/Italy/Spain also up
European orders supporting US defense jobs and backlog; ammunition production scaled 6x
IMF and others modeling 1%+ GDP European defense ramp with growth multipliers
Conflicting
Fragmented procurement and national priorities limit efficiency/output
Fiscal pressures (deficits, debt brakes) could slow some countries
US force posture debates and potential policy shifts under different administrations
One retrieval process. Proposes and describes; never confirms. Stated confidence is not displayed — an unscored number is decoration.
Possible blind spotsas of 2026-08-06
European prime contractors and dual-use tech catching up vs. US exporters
Ammunition, air defense, drones, and electronic warfare as highest-growth sub-segments
Supply-chain bottlenecks in propellants, chips, and rare materials for munitions
Second-order cyber/space and infrastructure protection spend
Land systems, Gulfstream, and shipbuilding with artillery/vehicle relevance to Europe
direct
partly
European vehicle/ammo production partnerships or orders
Slower land warfare demand if conflict dynamics shift
Pay attention here. Not buy this. The XS1 programme found no selection edge from naming names.
Price confirmationcurrent
Prices through 2026-11-19: median 3-month relative +1.9% · participation 2/4 beating SPY (on 2026-08-06: +7.4% · 3/4). Price confirms or challenges; it does not create the theme.
Aggregate European NATO defense budgets for 2027 guided flat or down in real terms versus 2026 — check by 2026-12-31
NATO publicly walks back 3.5% core target or major countries miss interim spending milestones — check by 2027-06-30
Falsifiers as supplied on 2026-08-06. Nine of twelve original falsifiers failed mechanical resolvability; the repaired manifest is pre-seal and unsealed, so none is resolved here.
Copper Electrification ScarcityESTABLISHED
Why nowas of 2026-08-06
Copper hit fresh all-time highs this week near $6.7/lb (~$14,000-14,200/t LME) on August 5-6 2026, up >50% YoY and extending the 2025-26 rally, after DRC imposed an immediate copper concentrate export ban and ongoing disruptions at Grasberg and Codelco’s El Teniente. Visible inventories collapsed further in July while US imports hit multi-year highs ahead of potential tariffs; 2026 deficit forecasts (ICSG/JPM ~150-330kt) are now biting in spot markets as AI data centers and grid build add incremental demand layers. The price level that makes substitution and new mine economics viable arrived in the last month.
Why-now pass as of 2026-08-06.
Current consensusconsensus · 2026-08-06
Copper is cyclical; new supply and substitution (aluminum) will balance the market; AI demand is overstated.
Grok read of 2026-08-06. Evidence basis claimed: industry reporting · macro data · analyst notes · price · single-source risk moderate
What is changingas of 2026-08-06
Forecasts now embed AI/grid as major incremental demand (copper call from ~28 Mt 2025 toward 42 Mt by 2040); grid requires 3-4x the copper of the data centers themselves; 2025-26 deficits projected (100k+ tons); prices tested higher levels amid mine disruptions (Grasberg etc.) and guidance cuts; language shifted to 'quiet crisis' and structural shortfall for energy transition + AI.
Consensus versus our assessmentdifferentiated
Now: The accounts and the tape disagree. Either early or wrong — not confirmation. The market may be pricing something the accounts do not yet show.
2026-08-06: Consensus is probably right and the market has already begun paying for it, which limits how differentiated this can be from here. — same fixed rule, applied to each date's measured streams. Rule outputs inherit the unvalidated thresholds.
Lifecycle
State ESTABLISHED · week 1 · first seen 2026-08-07 · 4 of 5 measured streams confirm — first observation, so this is a level, not a trend
As of 2026-08-07; UNVALIDATED (assigned under gate v1).
Source convergencefact · counts unvalidated
Stream
Now
2026-08-06
Unit
n
capex
44.6
31.2
median YoY %
n=2
estimates
4.72
8.04
median 90d EPS drift %
n=2
revisions
0.216
0.418
mean 30d breadth
n=2
ratings
1
0
net 90d up-down
n=1
price
-30.4
4.9
median 3m rel to SPY %
n=2
Now = measured this build (prices through 2026-11-19). Nominal 3 of 5 · effective 2 of 3 (on 2026-08-06: 4 of 5 · 3 of 3). Contradicting now: price. Silent now: none. Counts UNVALIDATED.
Grok's weekly readone stream · 2026-08-06
Read of 2026-08-06 — not refreshed. Momentum strengthening · sentiment improving
Supporting
S&P and others project large demand growth to 2040 from electrification including AI
Grid copper intensity far exceeds DC itself; US grid near capacity needing massive upgrades
Reuters surveys and bank forecasts showing 2025-26 deficits; supply disruptions reinforcing tightness
Hyperscaler and utility buildouts explicitly raising copper intensity discussions
Price action and trader commentary on insufficient mine pipeline for next decade
Conflicting
Some analyses argue AI copper demand overstated relative to EVs/renewables or that efficiency reduces it
Recycling and substitution potential; China demand variability
New projects and expansions could eventually respond to higher prices
One retrieval process. Proposes and describes; never confirms. Stated confidence is not displayed — an unscored number is decoration.
Possible blind spotsas of 2026-08-06
Permitting timelines for new mines (decades) vs. demand ramp
Geopolitical concentration of supply and processing
Second-order beneficiaries in mining equipment and explorers
Aluminum substitution limits in high-performance electrical applications
Pure-play copper with low-cost assets benefiting from structural deficits
direct
yes
Sustained deficits and price realization above incentives
Peruvian/operational issues or global recession cutting demand
Pay attention here. Not buy this. The XS1 programme found no selection edge from naming names.
Price confirmationcurrent
Prices through 2026-11-19: median 3-month relative -30.4% · participation 0/2 beating SPY (on 2026-08-06: +4.9% · 2/2). Price confirms or challenges; it does not create the theme.
Copper market moves into sustained surplus >300kt in 2027 forecasts from major banks/IEA equivalents with prices falling below $8,000/t average — check by 2027-06-30
AI/grid copper demand estimates revised down >25% by S&P/WoodMac or equivalent citing substitution or lower buildout — check by 2027-03-31
Falsifiers as supplied on 2026-08-06. Nine of twelve original falsifiers failed mechanical resolvability; the repaired manifest is pre-seal and unsealed, so none is resolved here.
Optical Networking for AIFROZEN
As AI clusters scale from 800G toward 1.6T+ interconnect, networking becomes the next infrastructure bottleneck after memory. Optical interconnect — modules, silicon photonics and the supply chain behind them — becomes the constraint on how large a coherent training cluster can be built.
Why now. UNMEASURED — the why-now pass covered the six tracked themes only; this hypothesis entered the incubator after it ran.
Why it might be wrong. Co-packaged optics could arrive fast enough that pluggable-module suppliers are disintermediated rather than enriched, which is why the same expansion lists CRDO, AAOI losers. The bottleneck may also simply move again — memory was the constraint eighteen months ago and stopped being it. And a hypothesis that is already circulating among infrastructure investors may be priced before any independent stream confirms it.
Frozen at its 2026-08-07 observation.
capex
58.6
median YoY %
estimates
14.58
median 90d EPS drift %
price
-7.7
median 3m rel to SPY %
ratings
4
net 90d up-down
revisions
0.73
mean 30d breadth
Measured 2026-08-07, after the graph was built; the graph was built without sight of these numbers. Frozen.
What changed: No new fundamental confirming item; recurring accumulation status is broker truth only.
Not yet confirmed: No genuinely new confirming item this week.
ACTUAL CONTRADICTORY EVIDENCE FOUND: Independent policy analysis argues co-located/onsite generation is often a temporary bridge while operators still seek grid access — not proof of permanent behind-the-meter primary economics for fuel cells. [Niskanen Center, 2026-01-15] | ENR reporting (2026-09-23) on Vineland/DataOne describes permitting, temporary gas-generator enforcement, and contested Bloom fuel-cell permanent-power plans (~250 MW guaranteed / 328 MW installed cited) — deployment friction for the held expression, not parent-theme falsification. [Engineering News-Record, 2026-09-23]
Open question (not contradiction): Customer permanence / post-grid retention and named-customer economics remain unresolved. Relative returns are price context, not contradictory evidence.
Price context (not contradiction): BE 5d -6.45% vs SPY -2.33% / AI-power basket -4.37%.
# Notes

Current broker expression and collected evidence follow. The legacy investment judgments are preserved below as prior methodology, not current conclusions.

# Notes

Weekly evidence through 2026-11-18. No order or account-change capability.

## BE / AI POWER

**THEME:** AI infrastructure is creating a time-to-power bottleneck; rapidly deployable behind-the-meter generation may be valuable when grid service takes years.

**VALUE CAPTURE:** Economics can accrue to immediate generation, fuel cells, gas turbines, grid equipment, transmission, cooling/power management, nuclear, and storage. For BE, the controlling question is whether Bloom becomes permanent infrastructure or only a bridge until grid power arrives.

**HOLDING:** Not held
**PRIOR THESIS CONFIDENCE:** INTACT / UNDER TEST.
**PRIOR EXPRESSION JUDGMENT:** INVESTIGATE — deployment speed is supported more clearly than permanent customer economics.
**ACCUMULATION STATUS:** UNKNOWN. No automatic change.

**ROB RESEARCH INBOX:** No material Research Inbox evidence entered this thesis review. Submission never constitutes endorsement or an automatic state transition.

**WHAT CHANGED THIS WEEK:** INSUFFICIENT DATA — no genuinely new proposition-level item. Formal event attribution is not built yet; current measured returns are reported separately below.

**BEST EVIDENCE WE ARE RIGHT:** INSUFFICIENT DATA — no genuinely new proposition-level item.

**BEST EVIDENCE WE ARE WRONG:** Over five sessions BE returned -6.45% versus SPY -2.33% and the equal-weight AI-power basket -4.37%. These returns do not establish event causation or customer economics. No captured customer evidence proves Bloom remains after grid connection.

**PRICE:** BE closed 2026-11-17 at $173.46. Five-day relative return was -4.12 points versus SPY and -2.08 points versus the AI-power basket. Twenty-day return was -22.09% (-17.33 points versus SPY). These measured relative returns do not themselves establish a fundamental thesis transition.

**MIGRATION:** POSSIBLY — the power theme remains credible, but current evidence does not show economics concentrating in BE rather than other power layers.

**WHAT MATTERS NEXT:** Named-customer economics and repeat behavior, actual installation time, deployment/MW/backlog conversion, contract duration, intended operating life, post-grid retention, and deployment margins.

**ACTION NEEDED:** INVESTIGATE. Review relative behavior and the bridge-versus-permanent question; do not alter recurring accumulation from this output alone.

**STATE EXPLANATION:** Prior state: PARENT=INTACT; VALUE_CAPTURE=UNCLEAR; EXPRESSION=INSUFFICIENT DATA; MARKET=NEGATIVE; MIGRATION=POSSIBLY. Controlling new evidence: no new fundamental evidence. Why it matters: It tests Bloom's time-to-power advantage, while the weekly response and missing permanence evidence prevent a stronger expression judgment. Prior proposed state (not reviewed again): THESIS INTACT / UNDER TEST; EXPRESSION INVESTIGATE. What would reverse it: Repeat permanent deployments with attractive margins strengthen it; temporary deployments or weak conversion/margins weaken it.

---

## AI MEMORY

**PARENT THESIS:** AI workloads are increasing the economic importance of memory bandwidth, capacity, latency, and data movement.

**VALUE CAPTURE:** Established HBM/DRAM remains the best-supported layer. This preserves the approved value-capture assessment; new evidence below is not a complete contract or margin dataset.

**DRAM ETF:** Not held. The incomplete retrieved look-through does not establish major weights. That makes DRAM broad across established leaders and storage, but not neutral: it deliberately emphasizes the incumbent memory chain. The response has no embedded effective date and is incomplete.

**MU:** Not held. Embedded exposure through DRAM requires dated look-through evidence; MU remains a direct competing expression. MU is the cleaner direct HBM/DRAM candidate because its results depend more directly on shipments, qualifications, yields, pricing, and margins. It can beat DRAM through share or superior margins; it can lag because it removes Samsung/SK Hynix diversification and adds execution, capital-cycle, and valuation risk.

**SNDK/HBF:** Not held. Monitored competing/emerging expression. SNDK stock strength is measurable; HBF commercial progress is separate. No captured source establishes tape-out, samples, customer evaluation, design win, volume, revenue, or margin contribution. Price strength does not advance the commercial ladder or prove migration.

**SEPARATE SNDK BUSINESS-MODEL QUESTION:** Do changes in NAND customer/contract economics make earnings and cash flows structurally more durable and predictable across the NAND cycle? This proposition is independent of HBF commercialization.

**ROB RESEARCH INBOX:** No material Research Inbox evidence entered this thesis review. Submission never constitutes endorsement or an automatic state transition.

**WHAT CHANGED THIS WEEK:** INSUFFICIENT DATA — no genuinely new proposition-level item. HBF evidence: No captured source establishes tape-out, samples, customer evaluation, design win, volume, revenue, or margin contribution.

**BEST EVIDENCE WE ARE RIGHT:** INSUFFICIENT DATA — no genuinely new proposition-level item. Measured twenty-session returns relative to SOXX: DRAM -3.29, MU -5.37, and SNDK -26.48 percentage points.

**BEST EVIDENCE WE ARE WRONG:** Captured contradictory evidence is reported separately below. Missing evidence is not proof that HBM/DRAM economics are unchanged; relative stock returns do not verify HBF economics.

**PRICE:** DRAM -4.21%/5d, -18.42%/20d, -3.29 pts vs SOXX/20d · MU -1.75%/5d, -20.50%/20d, -5.37 pts vs SOXX/20d · SNDK -7.30%/5d, -41.61%/20d, -26.48 pts vs SOXX/20d. Formal event-response analytics are not built yet.

**VALUE-CAPTURE MIGRATION:** NO FUNDAMENTAL EVIDENCE YET — HBM/DRAM remains the better-supported economic layer. SNDK price strength does not establish HBF commercial value capture.

**MONITORING:** Preserve the approved monitoring priority. Relative strength, when present, raises research priority; it never substitutes for customer evaluation, qualification, design-win, contracted volume, revenue, margin or material earnings contribution.

**WHAT MATTERS NEXT:** HBM pricing, shipments, margins and revisions; MU qualifications/yields; and a sourced SNDK/HBF customer evaluation, design win, contracted volume, revenue, or margin milestone.

**YES — PIVOT REVIEW requires:** weakening HBM/DRAM pricing, margins, shipments, share, or revisions together with HBF milestones converting to volume, revenue, or margins and persistent relative strength after those milestones.

**ACTION NEEDED:** WATCH / INVESTIGATE. DRAM is the broad candidate, MU the concentrated direct competing expression, and SNDK the emerging alternative. No automatic trade or pivot is authorized.

**STATE EXPLANATION:** Prior state: PARENT=INTACT; VALUE_CAPTURE=STABLE; EXPRESSION=INSUFFICIENT DATA; MARKET=NEGATIVE; MIGRATION=NO. Controlling new evidence: no new fundamental evidence. Why it matters: It supports present HBM scarcity, while missing HBF commercial milestones prevent a migration conclusion. Prior proposed state (not reviewed again): PARENT THESIS INTACT / UNDER TEST; HBM/DRAM LEADING; NO FUNDAMENTAL MIGRATION EVIDENCE; MONITORING ELEVATED. What would reverse it: Material HBM deterioration plus HBF volume/revenue/margin evidence triggers PIVOT REVIEW; easing memory demand weakens the parent thesis.

## ONE-SENTENCE BOOK VERDICT

Preserve the approved AI-power and established HBM/DRAM theses under test. Current broker holdings determine portfolio expression; customer economics and verified commercial evidence, not stock strength alone, determine whether a thesis or value-capture migration merits review.

**AI_POWER CAPTURED CONTRADICTORY EVIDENCE:** Independent policy analysis argues co-located/onsite generation is often a temporary bridge while operators still seek grid access — not proof of permanent behind-the-meter primary economics for fuel cells. [Niskanen Center, 2026-01-15](https://www.niskanencenter.org/bypassing-the-grid-wont-save-us-from-having-to-build-more-of-it/) | ENR reporting (2026-09-23) on Vineland/DataOne describes permitting, temporary gas-generator enforcement, and contested Bloom fuel-cell permanent-power plans (~250 MW guaranteed / 328 MW installed cited) — deployment friction for the held expression, not parent-theme falsification. [Engineering News-Record, 2026-09-23](https://www.enr.com/articles/63695-inside-the-vineland-data-center-power-dispute)

**AI_MEMORY CAPTURED CONTRADICTORY EVIDENCE:** No verified public evidence of HBF customer evaluation completion, design win, contracted HBF volume, HBF revenue, or HBF margin contribution as of Phase 2 review. Commercial ladder remains pre-sample for inference products. [Theme Intelligence Phase 2, 2026-09-25](phase2://sndk_hbf/absence_of_commercial_milestones) | Even on company-claimed NBM coverage, ~half of FY2027 bits (and ~1/3 of FY2028) remain outside multi-year floor contracts and still mark-to-market on NAND cycle pricing. Customer concentration and downturn resilience across a full downcycle remain unproven. Inventory rose y/y on the IR balance sheet. [Theme Intelligence Phase 2, 2026-09-25](phase2://sndk_nand/uncontracted_and_cycle_unproven)
DRAM — AI Memory · NOT HELD
PARENT THESIS: INTACT / UNDER TESTEXPRESSION: APPROPRIATE (broad) / INVESTIGATE peersACTION: WATCH / INVESTIGATEVALUE CAPTURE: STABLE — HBM/DRAM leading
What changed: No new fundamental confirming item for AI Memory this week.
Not yet confirmed: No genuinely new confirming item this week.
ACTUAL CONTRADICTORY EVIDENCE FOUND: No verified public evidence of HBF customer evaluation completion, design win, contracted HBF volume, HBF revenue, or HBF margin contribution as of Phase 2 review. Commercial ladder remains pre-sample for inference products. [Theme Intelligence Phase 2, 2026-09-25] | Even on company-claimed NBM coverage, ~half of FY2027 bits (and ~1/3 of FY2028) remain outside multi-year floor contracts and still mark-to-market on NAND cycle pricing. Customer concentration and downturn resilience across a full downcycle remain unproven. Inventory rose y/y on the IR balance sheet. [Theme Intelligence Phase 2, 2026-09-25]
Competing expressions: MU = direct/concentrated HBM/DRAM (separate from DRAM ETF look-through). SNDK = two separate propositions — (A) HBF ladder · (B) NAND/de-cycling business model.
HBF (Prop A) status: No captured HBF commercial milestone (tape-out→margin ladder).
What matters next: HBM pricing/shipments/margins; MU quals/yields; sourced SNDK commercial milestones — not stock strength alone.
Evidence & history (shared notes)
The full notes are under the BE card disclosure above (same notes). Notes as of 2026-11-18.
Names being watched
Research
Nominations and purchases are not confirming evidence. Ownership is Robinhood ACTIVE only.
Ticker
Why tracking
Held?
Research state
What changed
Next proof
AAPL
Watching; no thesis yet
NO
INSUFFICIENT DATA
—
Review sourced filings, results and commercial milestones; n…
ASTS
Watching; no thesis yet
NO
INSUFFICIENT DATA
—
Review sourced filings, results and commercial milestones; n…
CBRL
Watching; no thesis yet
NO
INSUFFICIENT DATA
—
Review sourced filings, results and commercial milestones; n…
CRWD
Watching; no thesis yet
NO
INSUFFICIENT DATA
—
Review sourced filings, results and commercial milestones; n…
DLO
Watching; no thesis yet
NO
INSUFFICIENT DATA
—
Review sourced filings, results and commercial milestones; n…
HCA
Watching; no thesis yet
NO
INSUFFICIENT DATA
—
Review sourced filings, results and commercial milestones; n…
MU
Continue explicitly requested monitoring; no investment merit inferred.
NO
INSUFFICIENT DATA
—
Review sourced filings, results and commercial milestones; n…
PBI
Watching; no thesis yet
NO
INSUFFICIENT DATA
—
Review sourced filings, results and commercial milestones; n…
PLTR
Watching; no thesis yet
NO
INSUFFICIENT DATA
—
Review sourced filings, results and commercial milestones; n…
SLS
Watching; no thesis yet
NO
INSUFFICIENT DATA
—
Review sourced filings, results and commercial milestones; n…
SNDK
Continue explicitly requested monitoring; no investment merit inferred.
NO
INSUFFICIENT DATA
—
Review sourced filings, results and commercial milestones; n…
AAPL — full research record
AAPL / Apple Inc.
Owned: no · as of 2026-11-20
Parent theme: UNASSIGNED
Why tracked: Rob explicitly nominated this security for research; nomination is not evidence.
Expression role: UNASSIGNED
Research state: INSUFFICIENT DATA
What changed: No verified research-state change since last Brief.
What matters next: Review sourced filings, results and commercial milestones; no verified conclusion inferred from nomination.
Value-capture proposition: Value-capture proposition not yet established.
Strongest confirmation: None yet — no current verified evidence for this proposition (not a contradiction).
Strongest contradiction: None yet — no current verified evidence for this proposition (not a contradiction).
Market context and review status
Status: LIVE · as of: 2026-11-17 · source: Yahoo Finance via yfinance · 20-session return %: 3.73 · vs SPY, 20 sessions %: 8.49 · Market context, never proof of commercialization or investment merit.
Verified evidence only; unavailable/stale claims do not fill confirmation or contradiction.
ASTS — full research record
ASTS / AST SpaceMobile, Inc.
Owned: no · as of 2026-11-20
Parent theme: UNASSIGNED
Why tracked: Rob explicitly nominated this security for research; nomination is not evidence.
Expression role: UNASSIGNED
Research state: INSUFFICIENT DATA
What changed: No verified research-state change since last Brief.
What matters next: Review sourced filings, results and commercial milestones; no verified conclusion inferred from nomination.
Value-capture proposition: Value-capture proposition not yet established.
Strongest confirmation: None yet — no current verified evidence for this proposition (not a contradiction).
Strongest contradiction: None yet — no current verified evidence for this proposition (not a contradiction).
Market context and review status
Status: LIVE · as of: 2026-11-17 · source: Yahoo Finance via yfinance · 20-session return %: -32.92 · vs SPY, 20 sessions %: -28.16 · Market context, never proof of commercialization or investment merit.
Verified evidence only; unavailable/stale claims do not fill confirmation or contradiction.
CBRL — full research record
CBRL / Cracker Barrel Old Country Store, Inc.
Owned: no · as of 2026-11-20
Parent theme: UNASSIGNED
Why tracked: Rob explicitly nominated this security for research; nomination is not evidence.
Expression role: UNASSIGNED
Research state: INSUFFICIENT DATA
What changed: No verified research-state change since last Brief.
What matters next: Review sourced filings, results and commercial milestones; no verified conclusion inferred from nomination.
Value-capture proposition: Value-capture proposition not yet established.
Strongest confirmation: None yet — no current verified evidence for this proposition (not a contradiction).
Strongest contradiction: None yet — no current verified evidence for this proposition (not a contradiction).
Market context and review status
Status: LIVE · as of: 2026-11-17 · source: Yahoo Finance via yfinance · 20-session return %: 4.32 · vs SPY, 20 sessions %: 9.08 · Market context, never proof of commercialization or investment merit.
Verified evidence only; unavailable/stale claims do not fill confirmation or contradiction.
CRWD — full research record
CRWD / CrowdStrike Holdings, Inc.
Owned: no · as of 2026-11-20
Parent theme: UNASSIGNED
Why tracked: Rob explicitly nominated this security for research; nomination is not evidence.
Expression role: UNASSIGNED
Research state: INSUFFICIENT DATA
What changed: No verified research-state change since last Brief.
What matters next: Review sourced filings, results and commercial milestones; no verified conclusion inferred from nomination.
Value-capture proposition: Value-capture proposition not yet established.
Strongest confirmation: None yet — no current verified evidence for this proposition (not a contradiction).
Strongest contradiction: None yet — no current verified evidence for this proposition (not a contradiction).
Market context and review status
Status: LIVE · as of: 2026-11-17 · source: Yahoo Finance via yfinance · 20-session return %: -3.43 · vs SPY, 20 sessions %: 1.33 · Market context, never proof of commercialization or investment merit.
Verified evidence only; unavailable/stale claims do not fill confirmation or contradiction.
DLO — full research record
DLO / DLocal Limited
Owned: no · as of 2026-11-20
Parent theme: UNASSIGNED
Why tracked: Rob explicitly nominated this security for research; nomination is not evidence.
Expression role: UNASSIGNED
Research state: INSUFFICIENT DATA
What changed: No verified research-state change since last Brief.
What matters next: Review sourced filings, results and commercial milestones; no verified conclusion inferred from nomination.
Value-capture proposition: Value-capture proposition not yet established.
Strongest confirmation: None yet — no current verified evidence for this proposition (not a contradiction).
Strongest contradiction: None yet — no current verified evidence for this proposition (not a contradiction).
Market context and review status
Status: LIVE · as of: 2026-11-17 · source: Yahoo Finance via yfinance · 20-session return %: -17.92 · vs SPY, 20 sessions %: -13.16 · Market context, never proof of commercialization or investment merit.
Verified evidence only; unavailable/stale claims do not fill confirmation or contradiction.
HCA — full research record
HCA / HCA Healthcare, Inc.
Owned: no · as of 2026-11-20
Parent theme: UNASSIGNED
Why tracked: Rob explicitly nominated this security for research; nomination is not evidence.
Expression role: UNASSIGNED
Research state: INSUFFICIENT DATA
What changed: No verified research-state change since last Brief.
What matters next: Review sourced filings, results and commercial milestones; no verified conclusion inferred from nomination.
Value-capture proposition: Value-capture proposition not yet established.
Strongest confirmation: None yet — no current verified evidence for this proposition (not a contradiction).
Strongest contradiction: None yet — no current verified evidence for this proposition (not a contradiction).
Market context and review status
Status: LIVE · as of: 2026-11-17 · source: Yahoo Finance via yfinance · 20-session return %: 7.61 · vs SPY, 20 sessions %: 12.37 · Market context, never proof of commercialization or investment merit.
Verified evidence only; unavailable/stale claims do not fill confirmation or contradiction.
MU — full research record
MU / Micron Technology, Inc.
Owned: no · as of 2026-11-20
Parent theme: AI_MEMORY
Why tracked: Continue explicitly requested monitoring; no investment merit inferred.
What changed: No verified research-state change since last Brief.
What matters next: Review sourced filings, results and commercial milestones; no verified conclusion inferred from nomination.
Value-capture proposition: Direct concentrated HBM/DRAM economics; distinguish direct MU ownership from dated DRAM ETF look-through.
Strongest confirmation: None yet — no current verified evidence for this proposition (not a contradiction).
Strongest contradiction: None yet — no current verified evidence for this proposition (not a contradiction).
MU direct ownership versus ETF look-through: Direct ownership is the broker label above. DRAM look-through is separate, dated retrieval evidence; an unknown effective date does not establish current weight. {"provider": "Yahoo Finance DRAM fund holdings", "retrieved_utc": "2026-11-19", "effective_date": null, "completeness": "INCOMPLETE_TOP_HOLDINGS_RESPONSE", "holdings": [{"symbol": "005930.KQ", "name": "Samsung Electronics Co Ltd", "weight_pct": 18.95}, {"symbol": "FGXXX", "name": "First American Government Obligs X", "weight_pct": 16.62}, {"symbol": "000660.KQ", "name": "SK hynix Inc", "weight_pct": 15.92}]}
Market context and review status
Status: LIVE · as of: 2026-11-17 · source: Yahoo Finance via yfinance · 20-session return %: -20.5 · vs SPY, 20 sessions %: -15.73 · Market context, never proof of commercialization or investment merit.
Verified evidence only; unavailable/stale claims do not fill confirmation or contradiction.
PBI — full research record
PBI / Pitney Bowes Inc.
Owned: no · as of 2026-11-20
Parent theme: UNASSIGNED
Why tracked: Rob explicitly nominated this security for research; nomination is not evidence.
Expression role: UNASSIGNED
Research state: INSUFFICIENT DATA
What changed: No verified research-state change since last Brief.
What matters next: Review sourced filings, results and commercial milestones; no verified conclusion inferred from nomination.
Value-capture proposition: Value-capture proposition not yet established.
Strongest confirmation: None yet — no current verified evidence for this proposition (not a contradiction).
Strongest contradiction: None yet — no current verified evidence for this proposition (not a contradiction).
Market context and review status
Status: LIVE · as of: 2026-11-17 · source: Yahoo Finance via yfinance · 20-session return %: -12.51 · vs SPY, 20 sessions %: -7.75 · Market context, never proof of commercialization or investment merit.
Verified evidence only; unavailable/stale claims do not fill confirmation or contradiction.
PLTR — full research record
PLTR / Palantir Technologies Inc.
Owned: no · as of 2026-11-20
Parent theme: UNASSIGNED
Why tracked: Rob explicitly nominated this security for research; nomination is not evidence.
Expression role: UNASSIGNED
Research state: INSUFFICIENT DATA
What changed: No verified research-state change since last Brief.
What matters next: Review sourced filings, results and commercial milestones; no verified conclusion inferred from nomination.
Value-capture proposition: Value-capture proposition not yet established.
Strongest confirmation: None yet — no current verified evidence for this proposition (not a contradiction).
Strongest contradiction: None yet — no current verified evidence for this proposition (not a contradiction).
Market context and review status
Status: LIVE · as of: 2026-11-17 · source: Yahoo Finance via yfinance · 20-session return %: -18.71 · vs SPY, 20 sessions %: -13.95 · Market context, never proof of commercialization or investment merit.
Verified evidence only; unavailable/stale claims do not fill confirmation or contradiction.
SLS — full research record
SLS / SELLAS Life Sciences Group, Inc.
Owned: no · as of 2026-11-20
Parent theme: UNASSIGNED
Why tracked: Rob explicitly nominated this security for research; nomination is not evidence.
Expression role: UNASSIGNED
Research state: INSUFFICIENT DATA
What changed: No verified research-state change since last Brief.
What matters next: Review sourced filings, results and commercial milestones; no verified conclusion inferred from nomination.
Value-capture proposition: Value-capture proposition not yet established.
Strongest confirmation: None yet — no current verified evidence for this proposition (not a contradiction).
Strongest contradiction: None yet — no current verified evidence for this proposition (not a contradiction).
Market context and review status
Status: LIVE · as of: 2026-11-17 · source: Yahoo Finance via yfinance · 20-session return %: 59.85 · vs SPY, 20 sessions %: 64.61 · Market context, never proof of commercialization or investment merit.
Verified evidence only; unavailable/stale claims do not fill confirmation or contradiction.
SNDK — full research record
SNDK / Sandisk Corporation
Owned: no · as of 2026-11-20
Parent theme: AI_MEMORY
Why tracked: Continue explicitly requested monitoring; no investment merit inferred.
Expression role: competing/emerging expression
Research state: INSUFFICIENT DATA
What changed: No verified research-state change since last Brief.
What matters next: Review sourced filings, results and commercial milestones; no verified conclusion inferred from nomination.
Value-capture proposition: HBF / AI-memory value capture requires commercial and fundamental milestones; price strength alone is not commercialization.
Strongest confirmation: None yet — no current verified evidence for this proposition (not a contradiction).
Strongest contradiction: None yet — no current verified evidence for this proposition (not a contradiction).
Value-capture proposition: NAND customer-contract/business-model changes may reduce cyclicality and improve earnings/cash-flow durability independently of HBF.
Strongest confirmation: None yet — no current verified evidence for this proposition (not a contradiction).
Strongest contradiction: None yet — no current verified evidence for this proposition (not a contradiction).
Market context and review status
Status: LIVE · as of: 2026-11-17 · source: Yahoo Finance via yfinance · 20-session return %: -41.61 · vs SPY, 20 sessions %: -36.85 · Market context, never proof of commercialization or investment merit.
Verified evidence only; unavailable/stale claims do not fill confirmation or contradiction.
09
Housekeeping
weaknesses, on the record
Why this page stopped updating in Auguststatus
Two separate reasons. (1) The instrument: on 2026-08-06 the promotion gate was run against random baskets of stocks and every random basket passed — so the gate, and the convergence counts that use the same thresholds, could not tell a real theme from the market tide. A stricter v2 gate (cross-sectional percentiles, frozen validation manifest with a one-time holdout) was designed but never approved or run, the base-rate study failed for lack of capex history, and the weak-form study cannot report before 2027-02-07. With no valid gate, no new weekly observation was chained. (2) The plumbing: the page builder had its date hard-coded to 2026-08-07 and nothing scheduled it, so even prices froze.
What changed on 2026-10-31. The page is now built on every publish. Prices and the measured company streams are refreshed each build; the narrative, states, overlap and incubator stay as recorded and carry their dates. Gate v2 still needs Rob's approval before it is run — nothing here runs it or opens its holdout.
What was rejectedhonesty
Nothing was rejected in week 1 (2026-08-06). Grok proposed 6 themes and all 6 were carried through. A discovery process with a 100% acceptance rate is transcribing, not selecting — a weakness of week 1, not a strength. No discovery run has happened since.
Are these separate themes?fact
6 named · 5.57 effective once shared companies are accounted for (overlap as of 2026-08-06).
Empty — no theme has died yet. This section is permanent. An empty graveyard after one week means nothing; after a year it would mean the system never kills anything, which would itself be the finding.
10
Charts & decisions
21 names
One card per named company across the six themes. TAKE / PASS / DEFER records what you would do; it places
nothing. Submit at the bottom seals every call into one block to paste into chat.
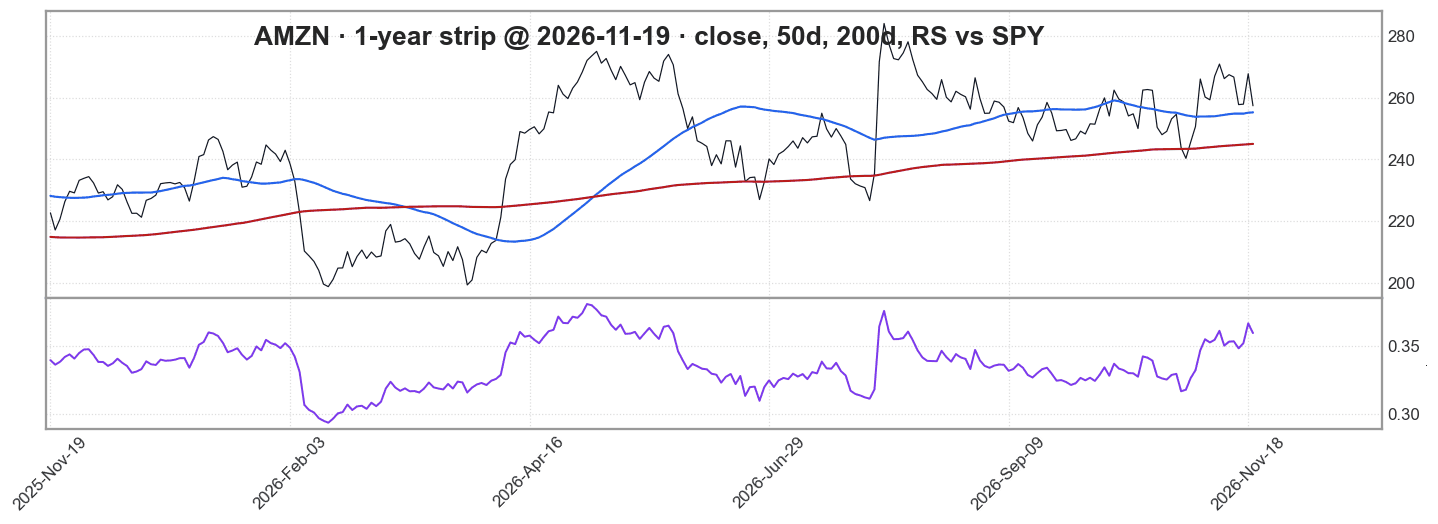
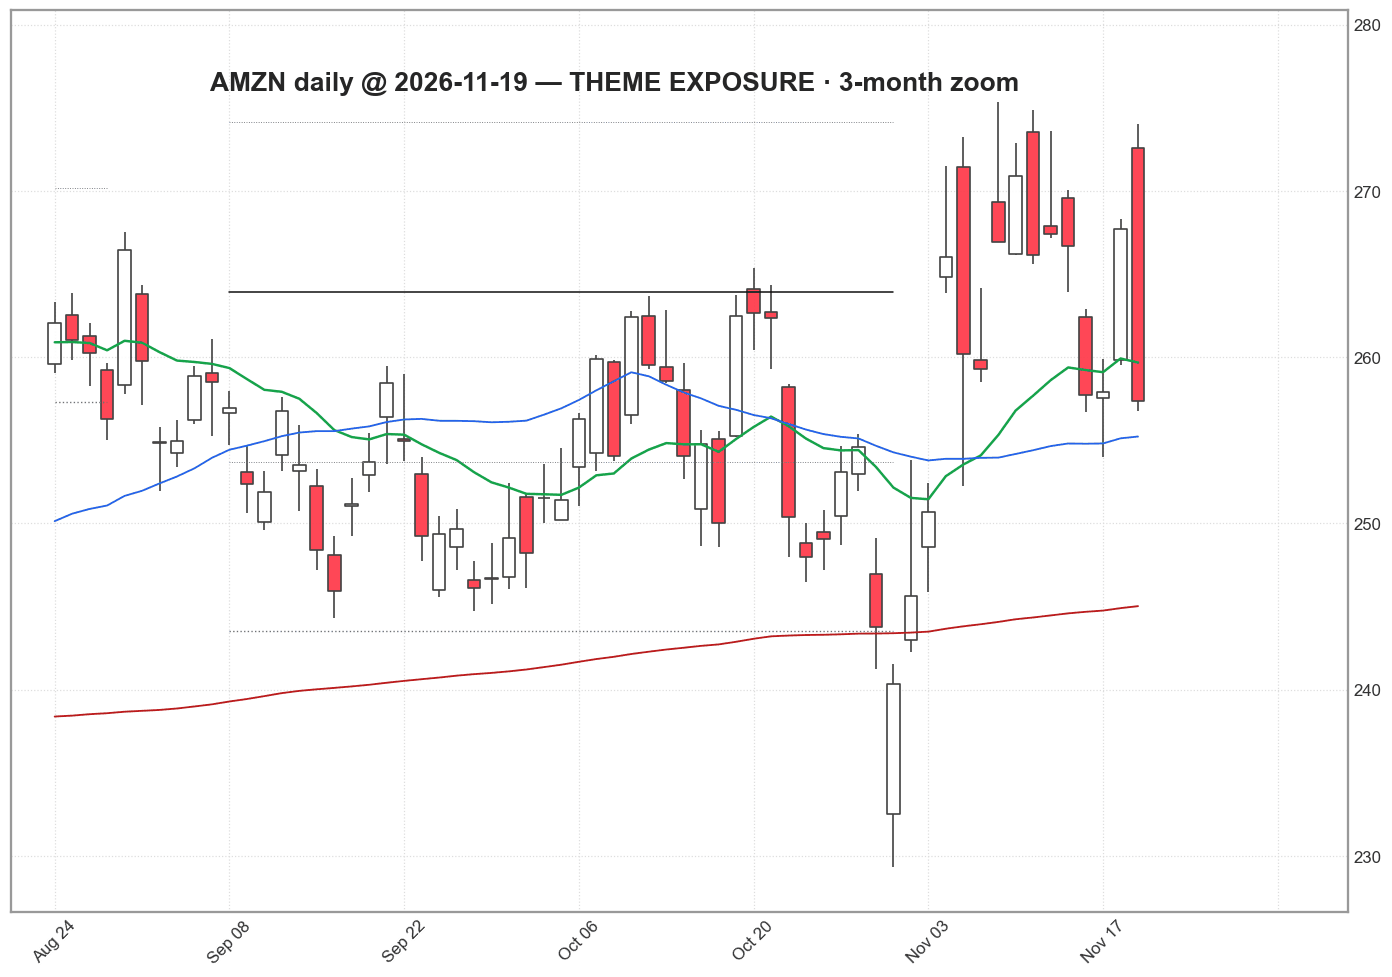
AMZN · Hyperscaler Capex Supercycle · 3M vs SPY +6.2%
price trend: strongPrices 2026-11-19
Named by the 2026-08-06 Grok read as exposed to Hyperscaler Capex Supercycle. Measured status this build: streams up. Theme exposure is a watchlist reason, not a signal. Source: Robinhood daily bars (Yahoo backup) through 2026-11-19; fundamentals via yfinance this build; theme membership from runs/THEME-2026-08-06.json
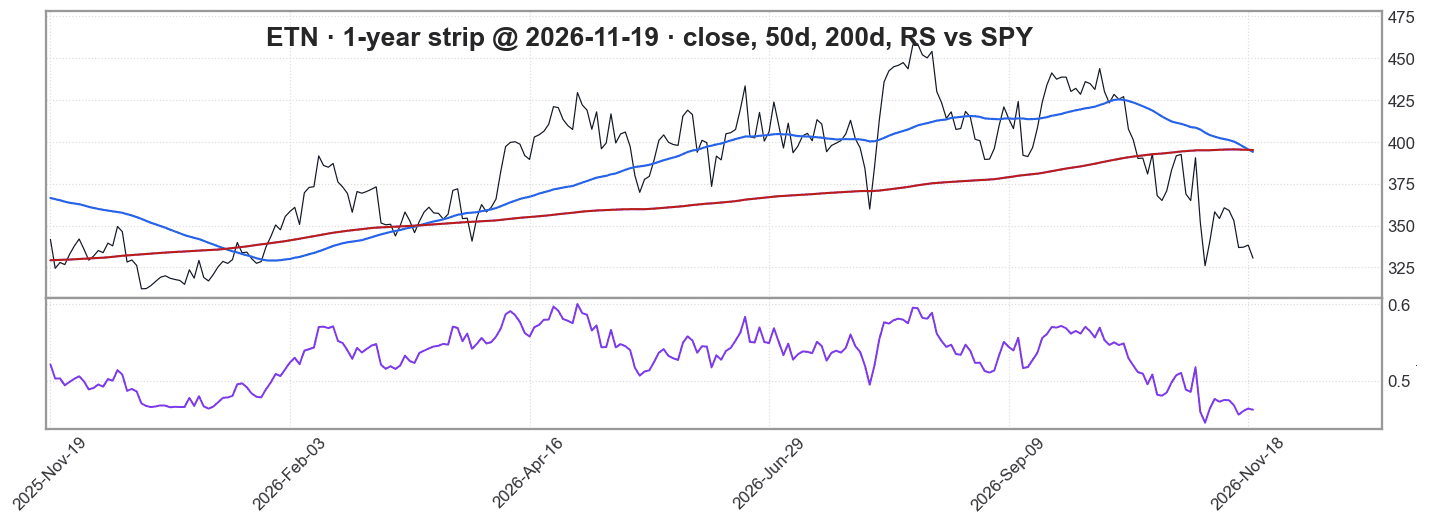
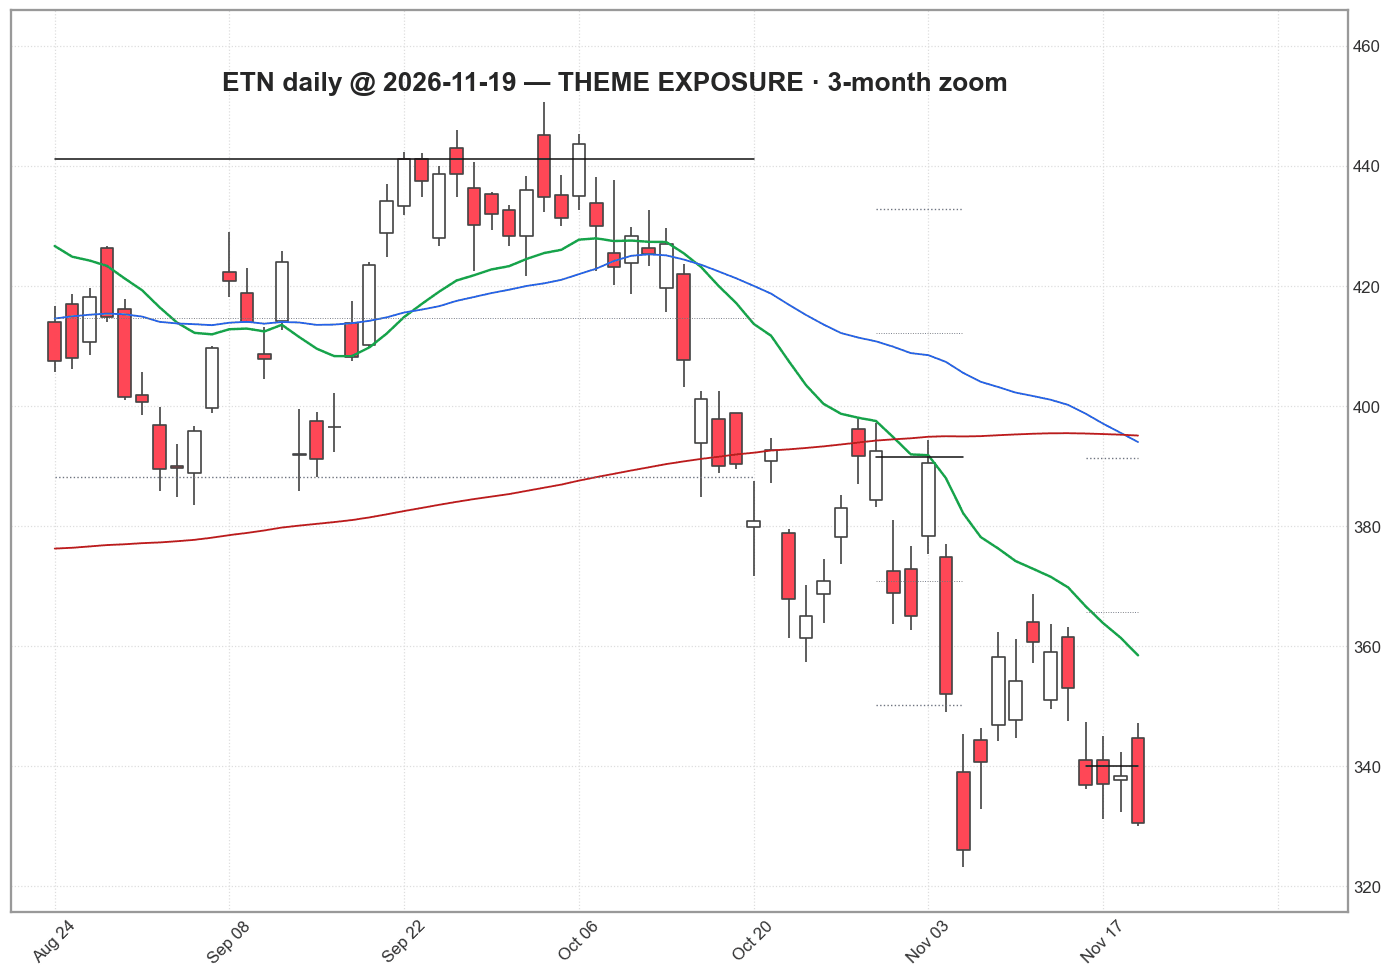
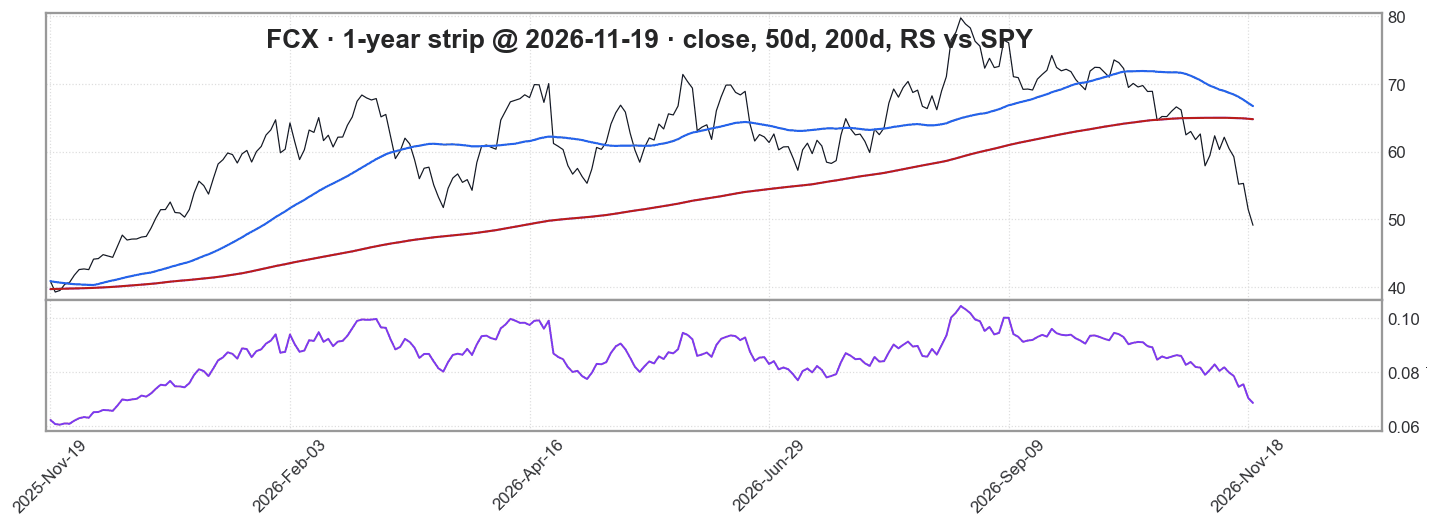
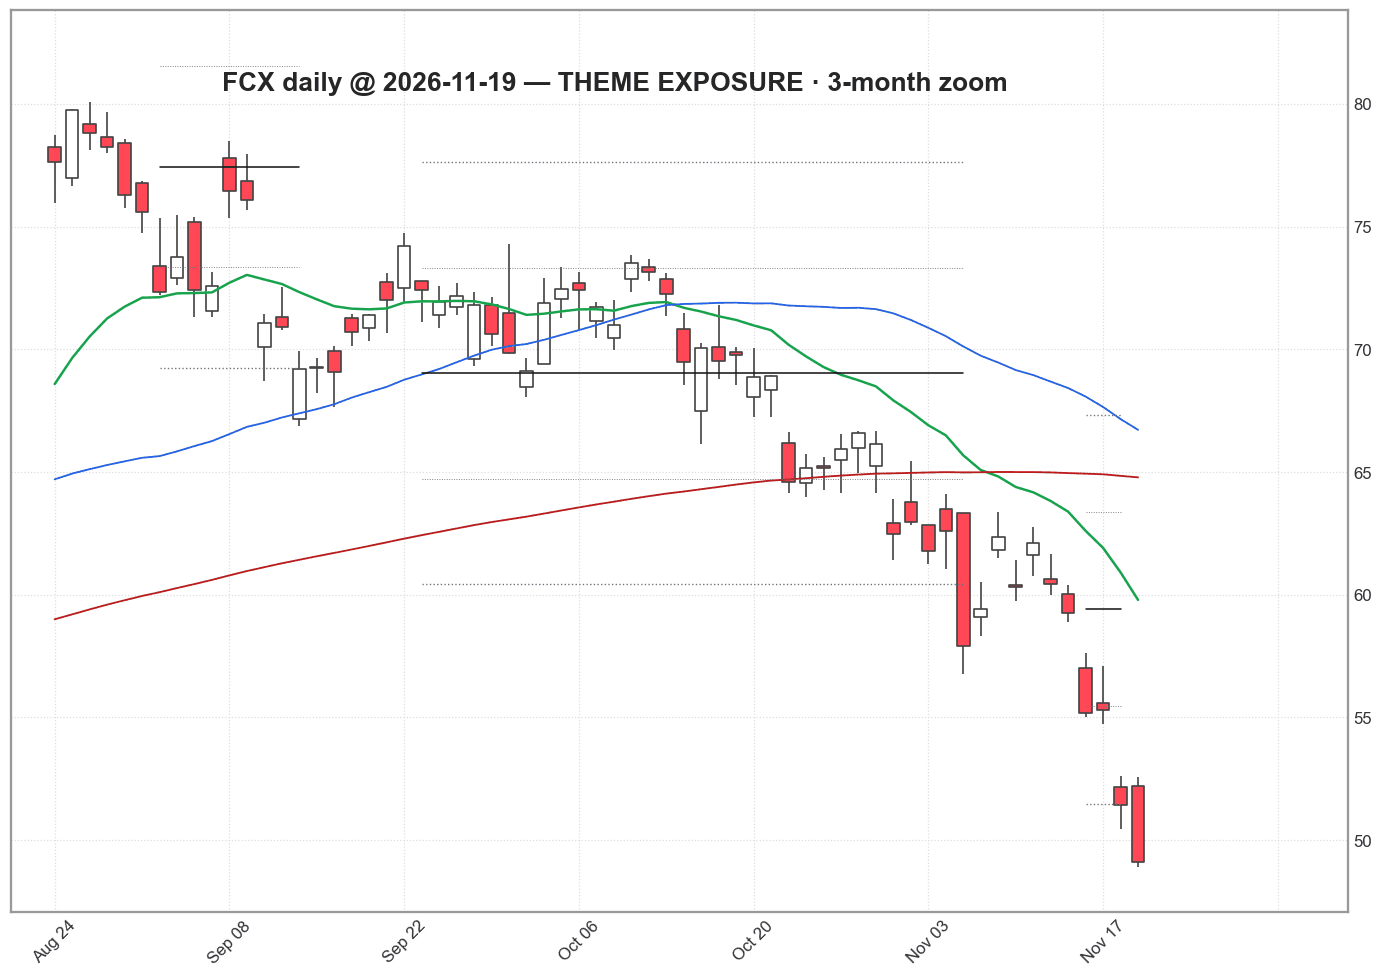
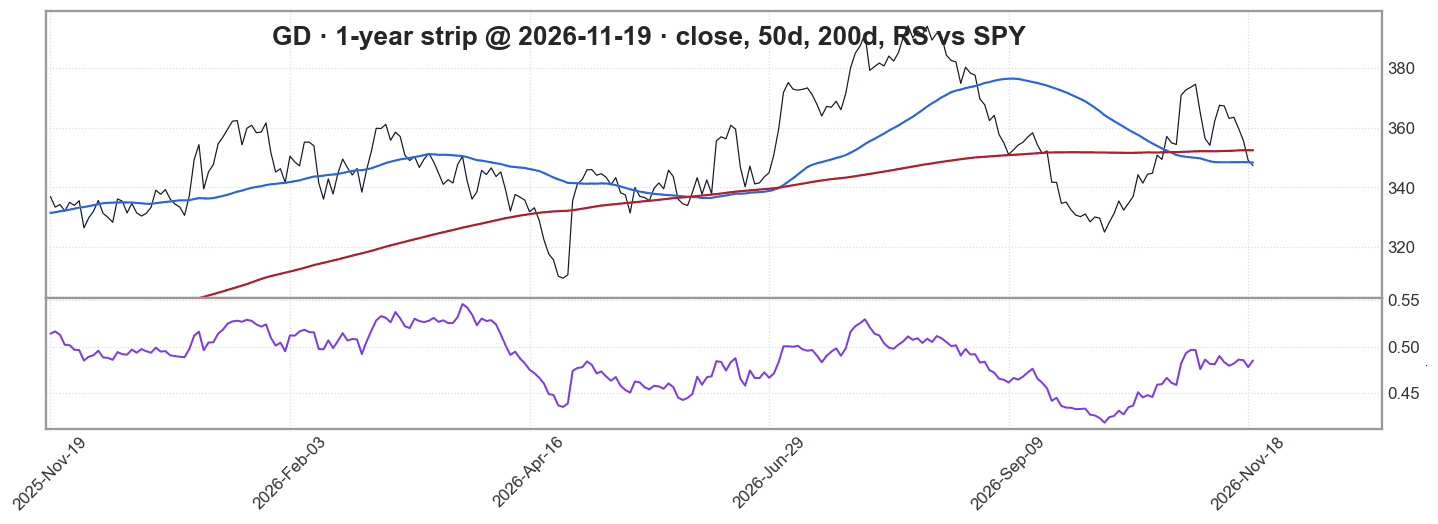
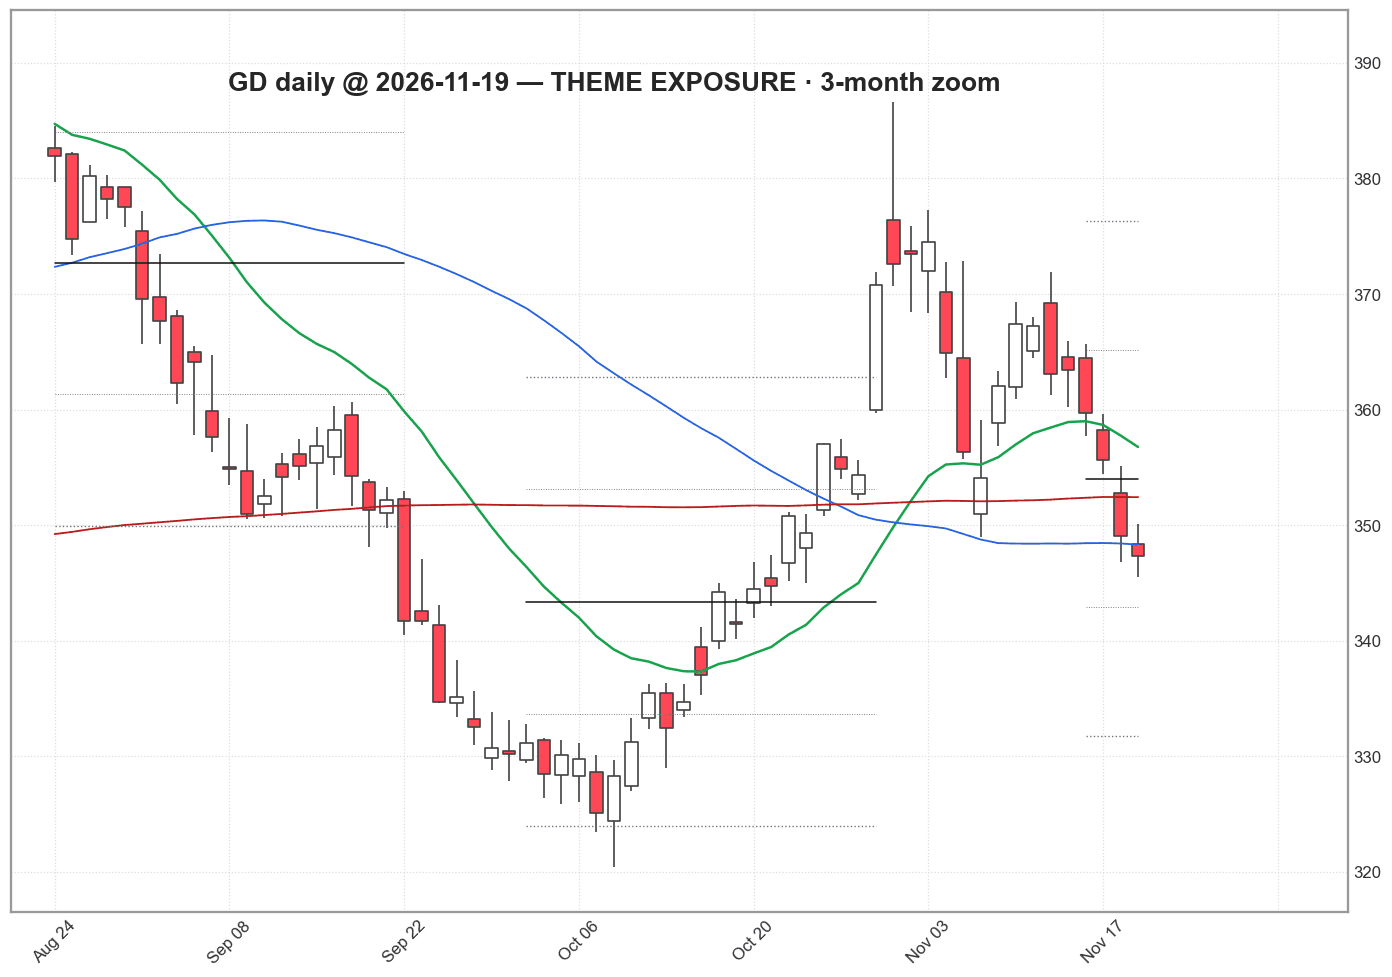
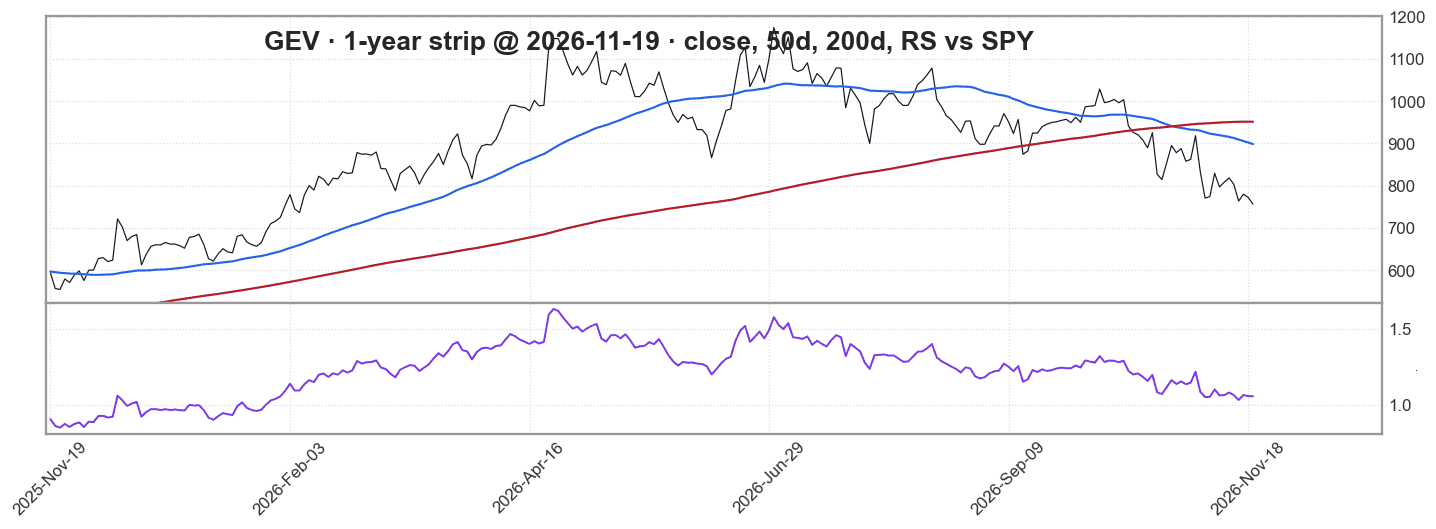
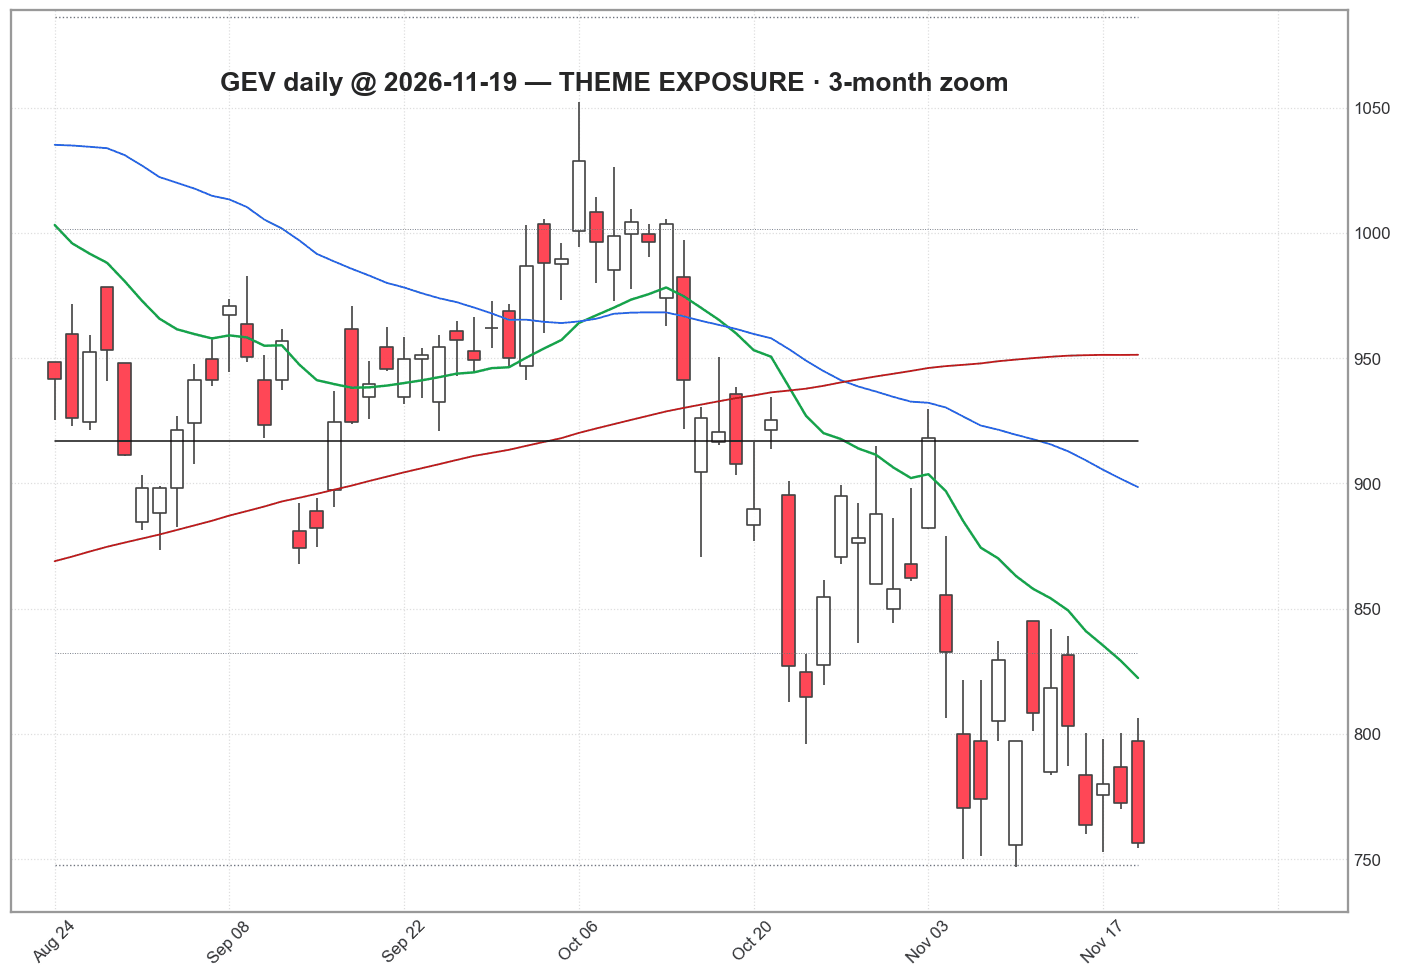
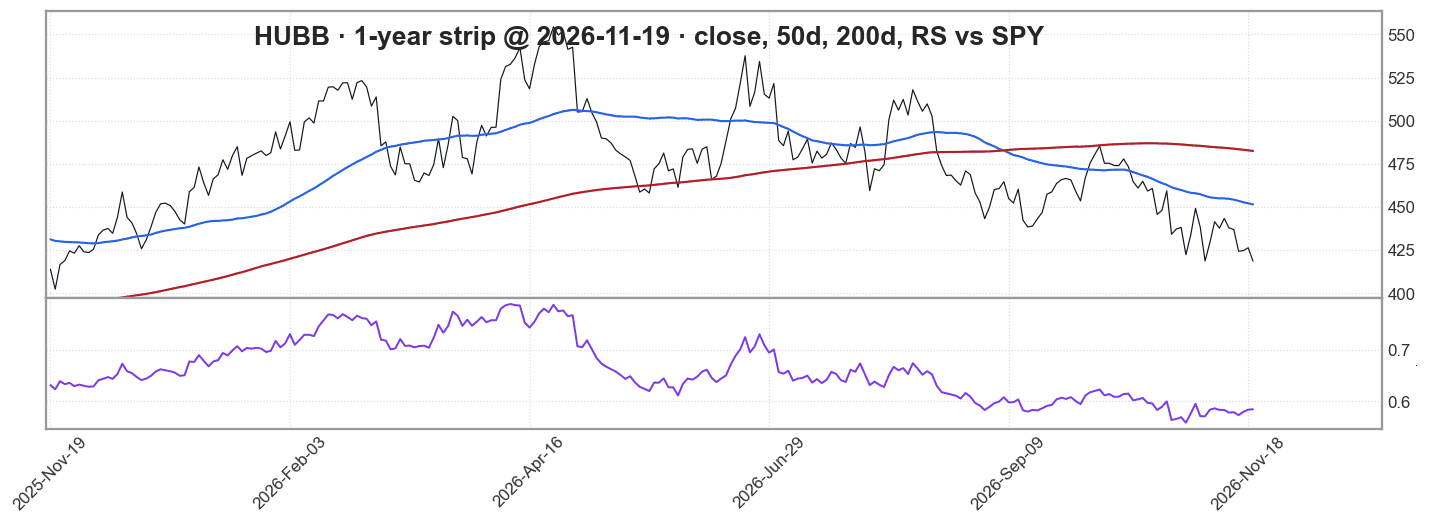
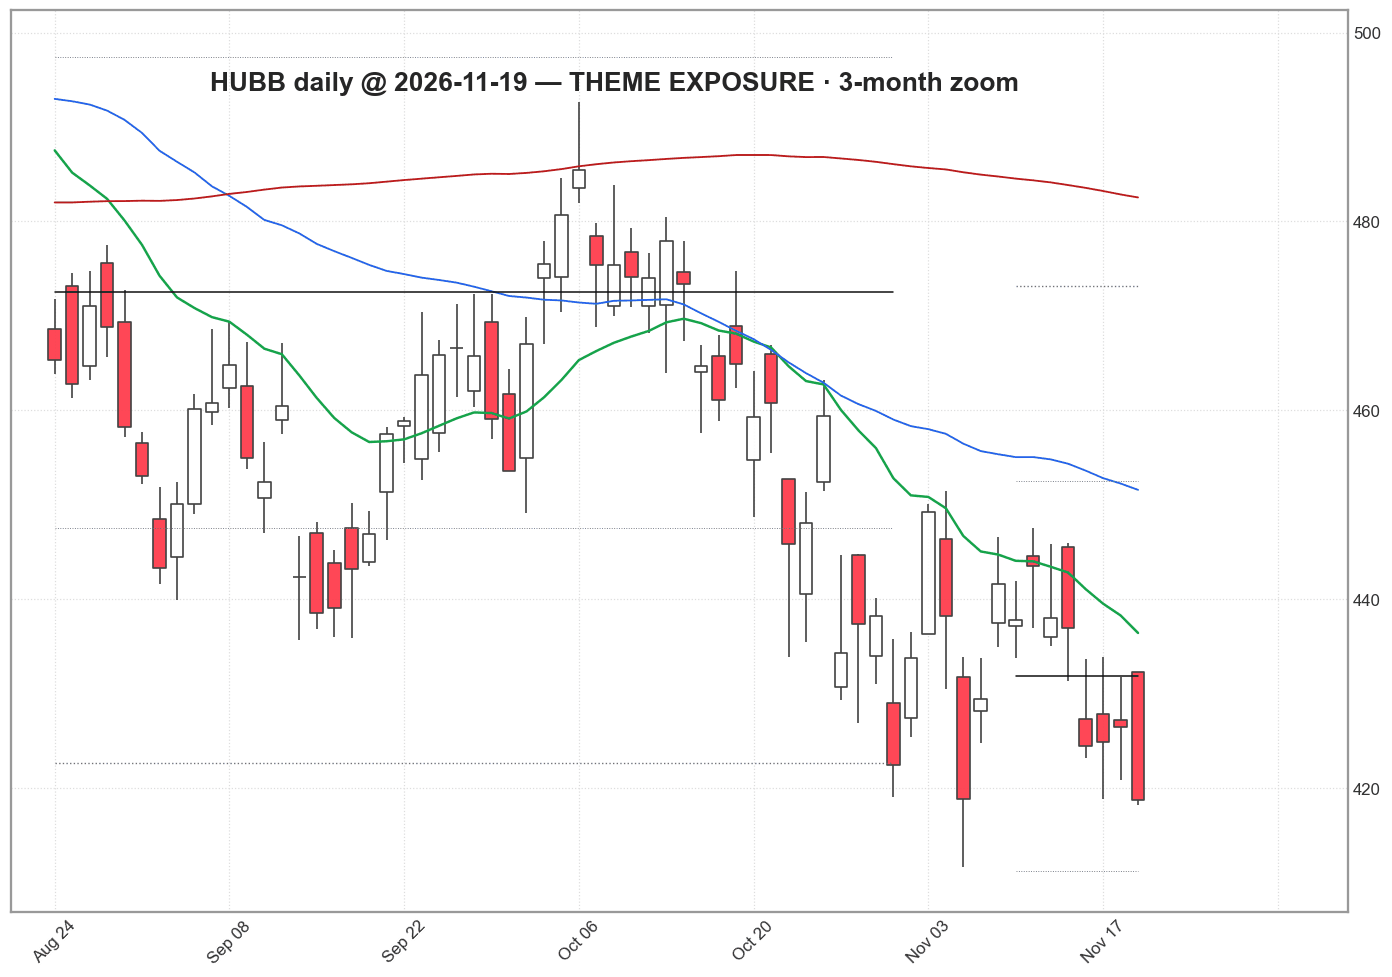
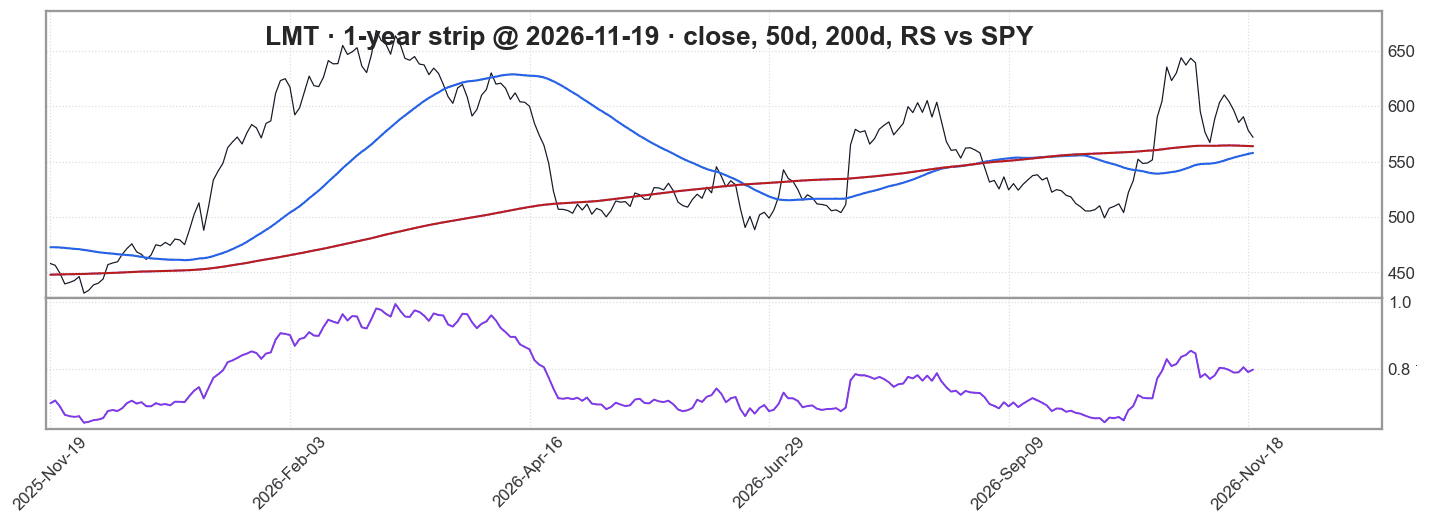
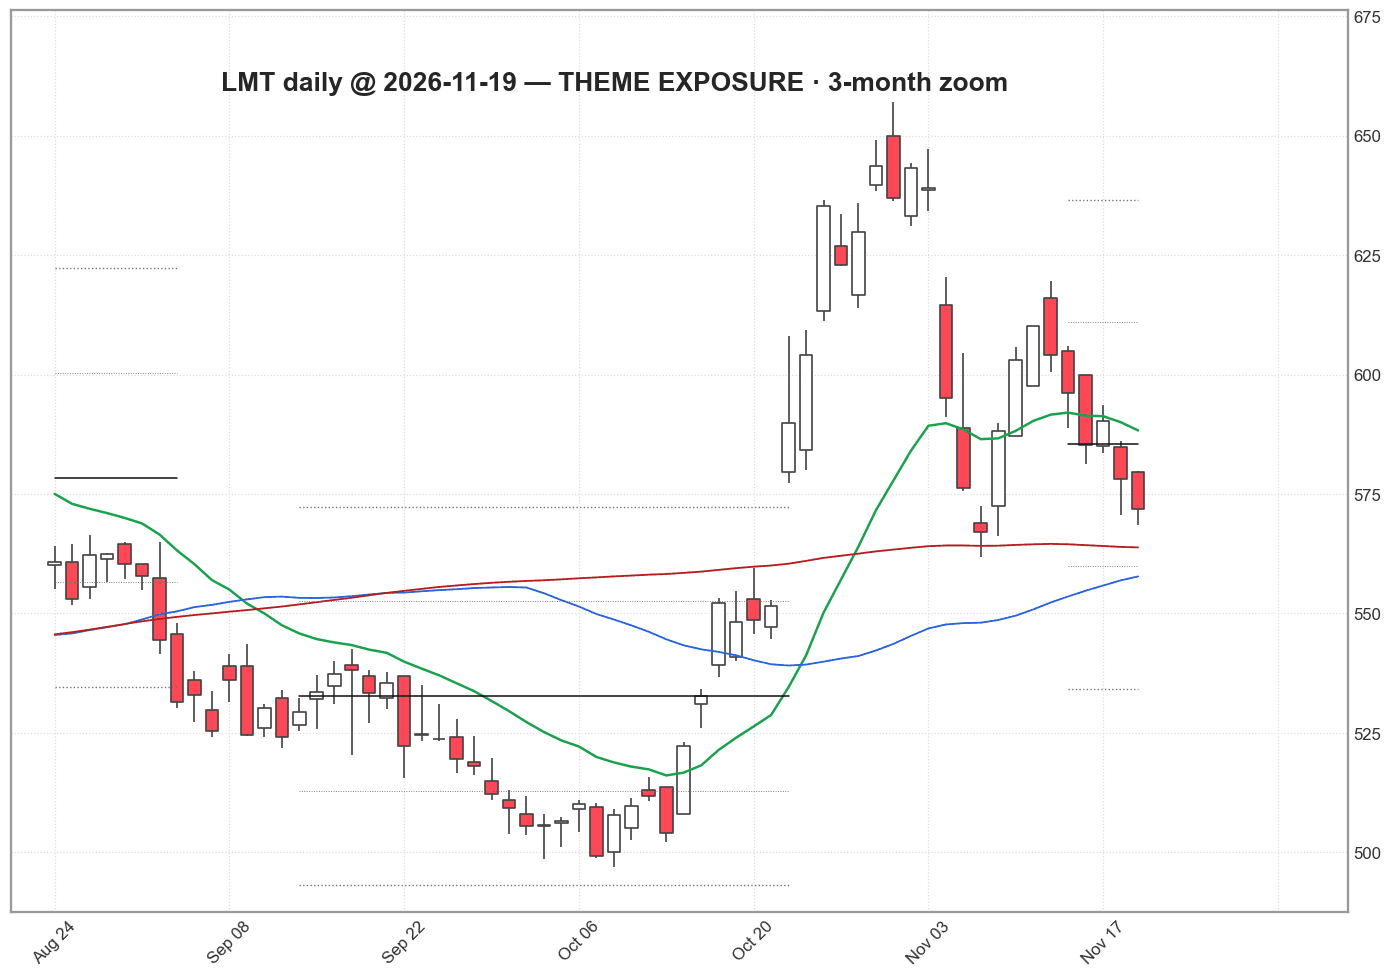
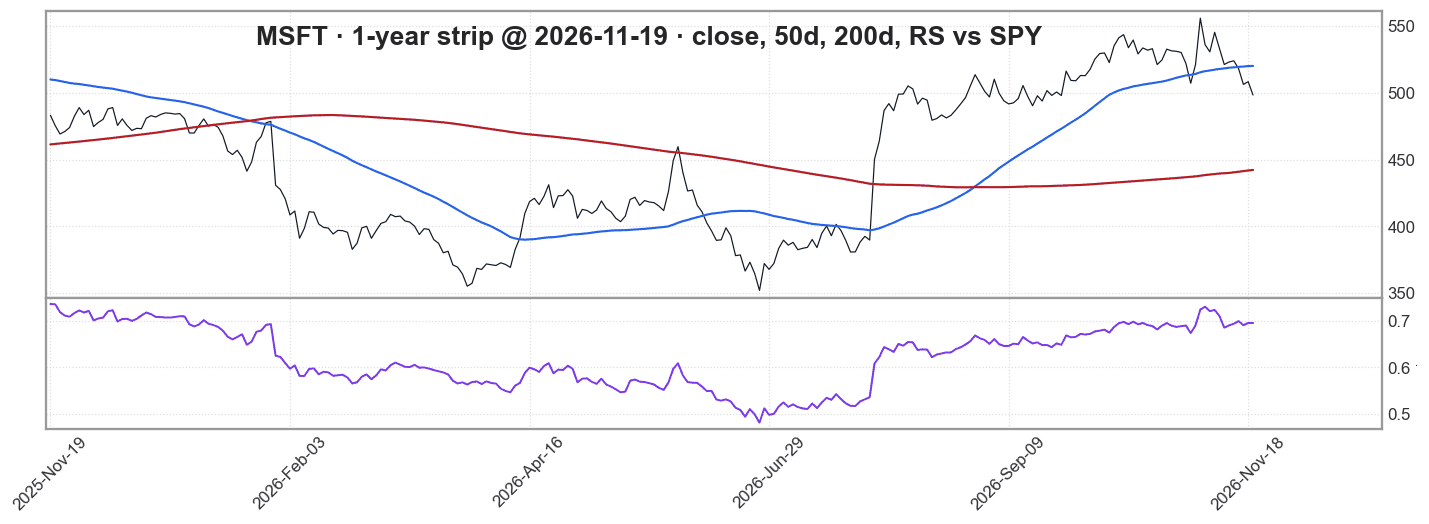
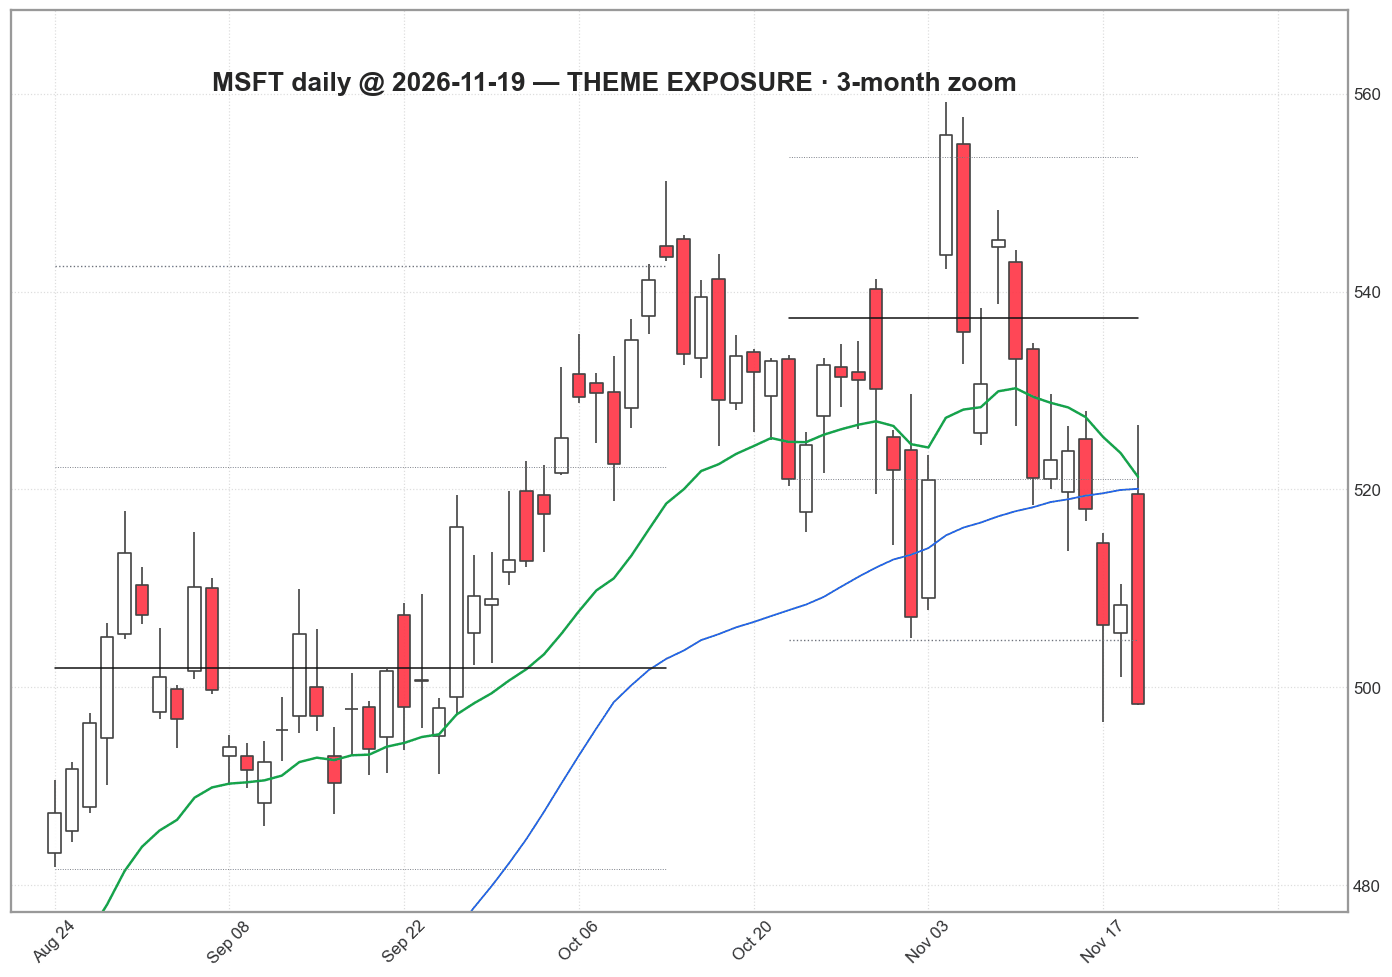
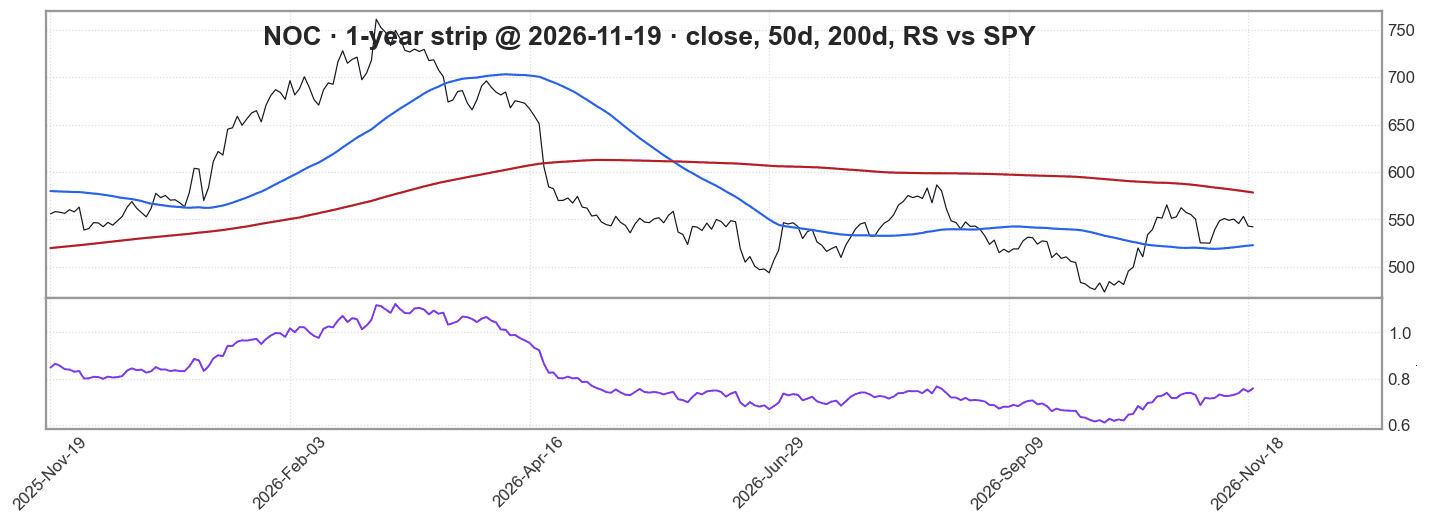
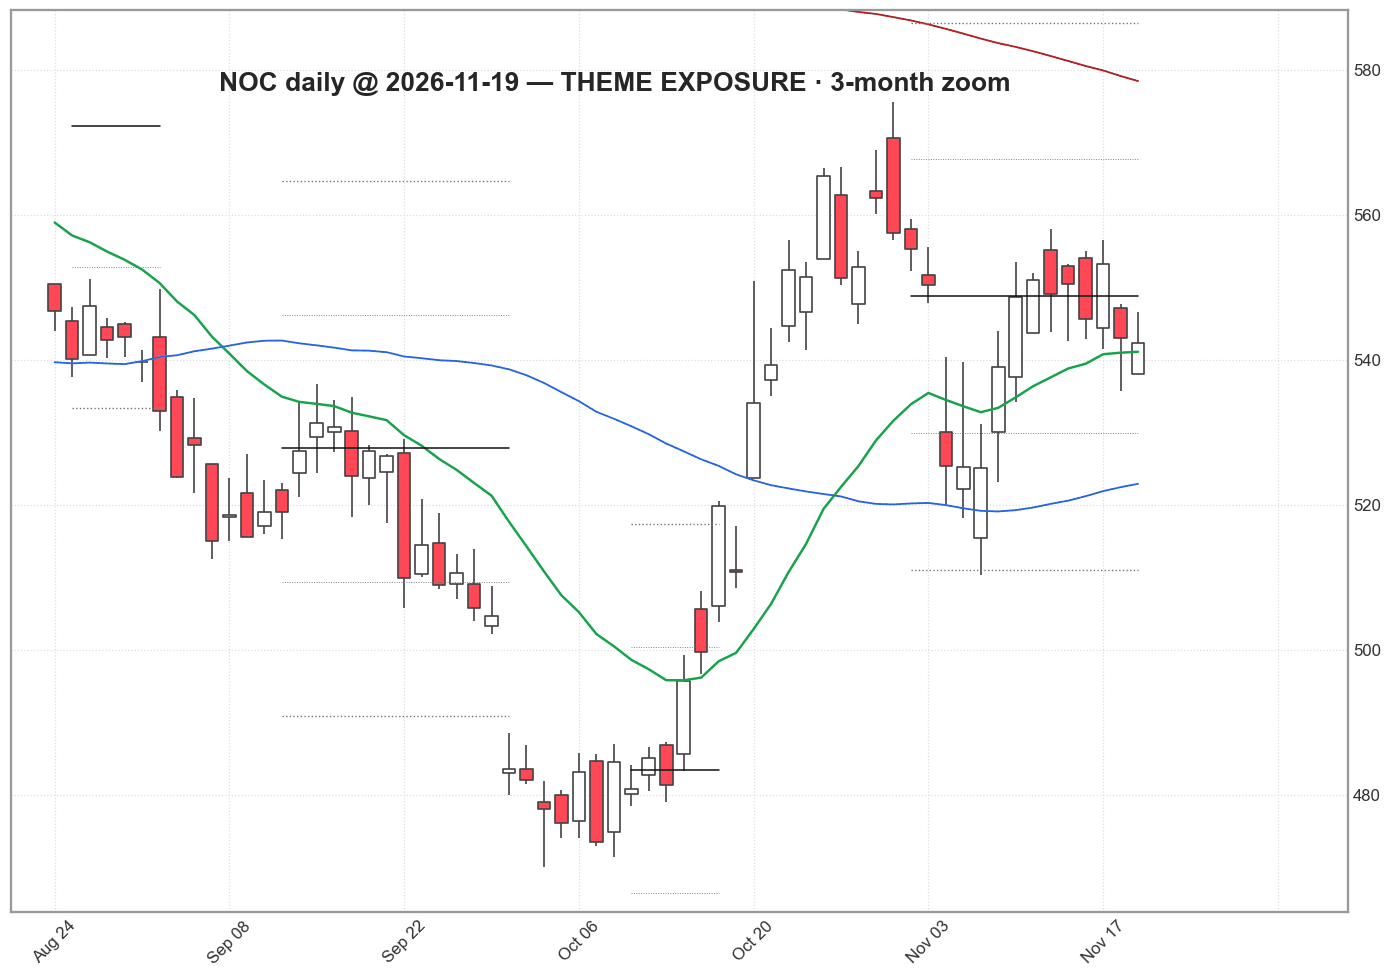
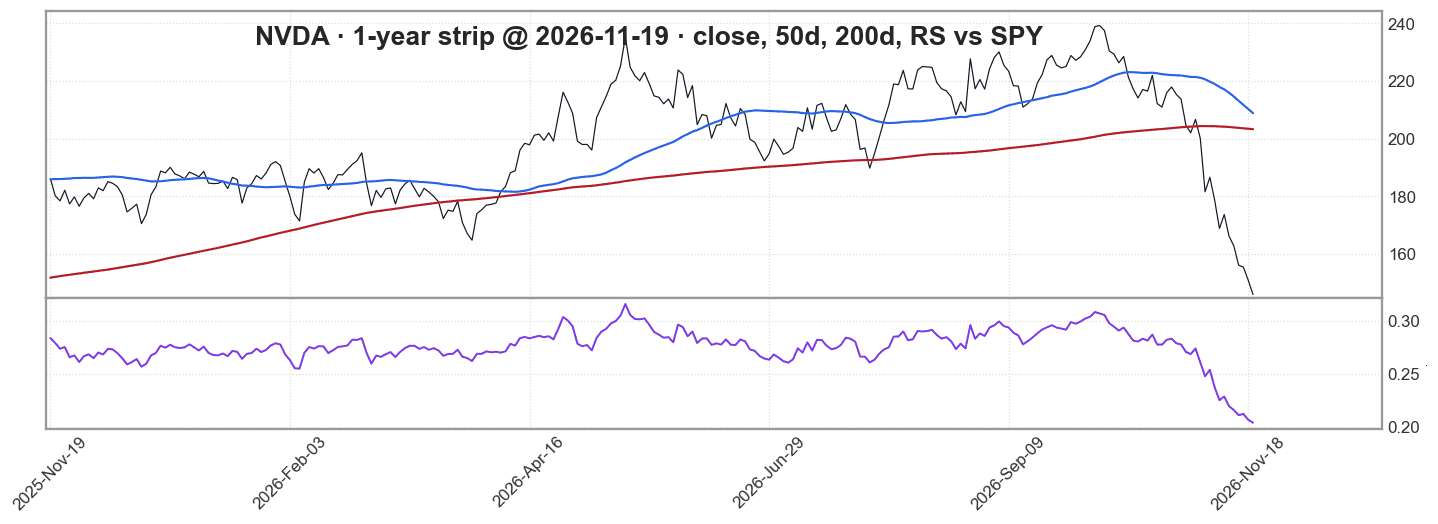
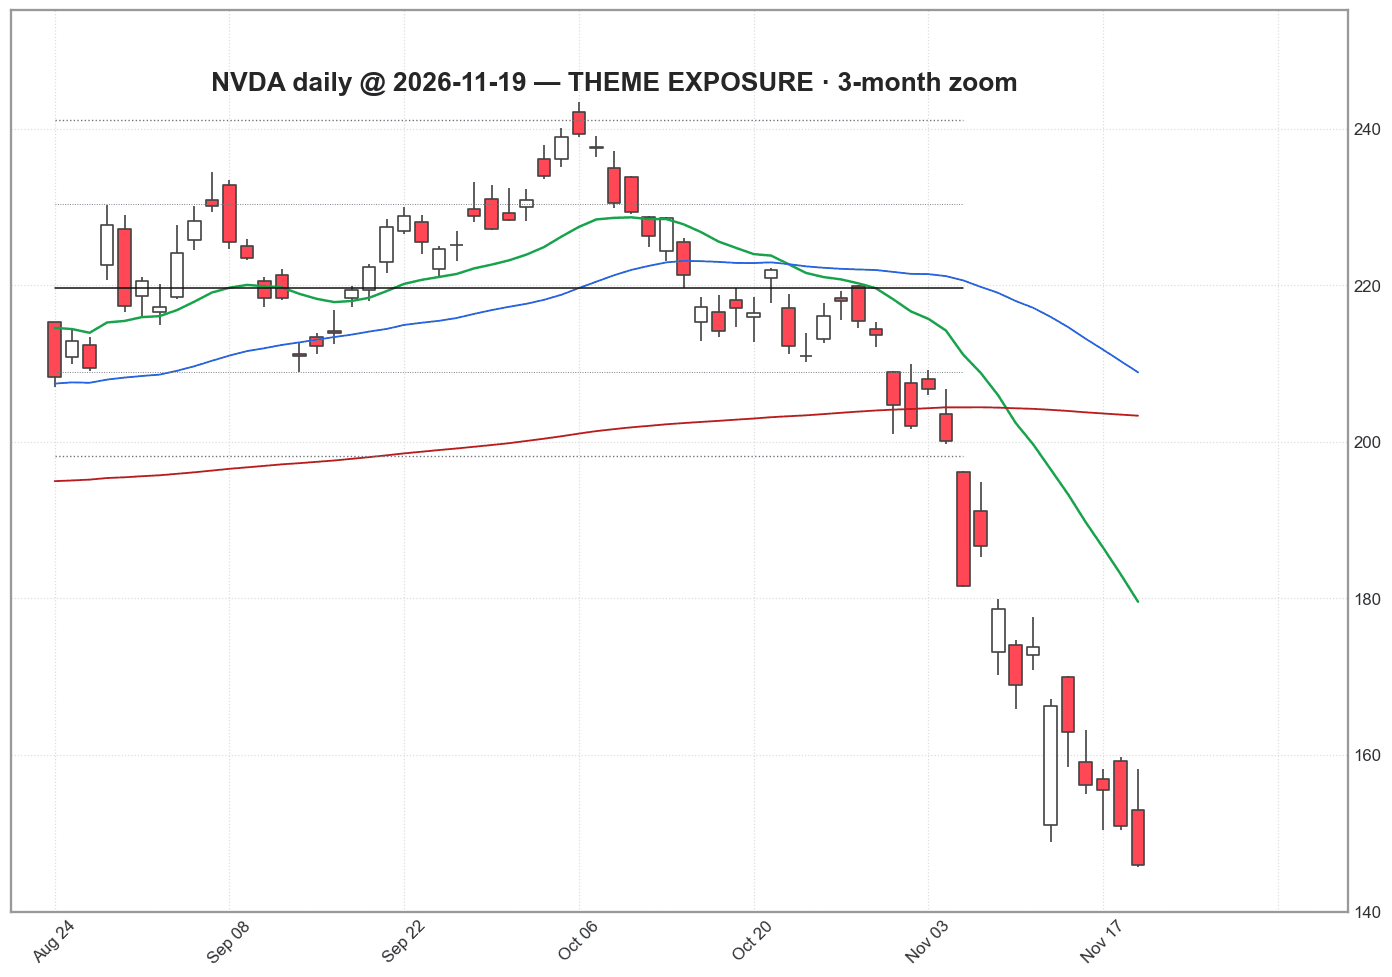
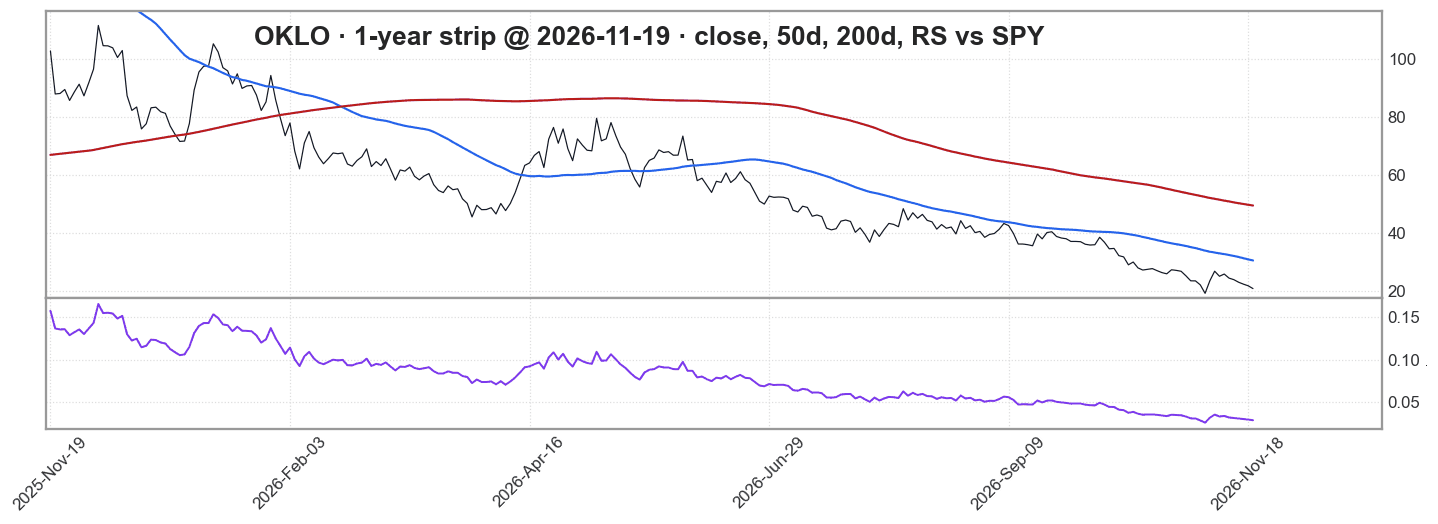
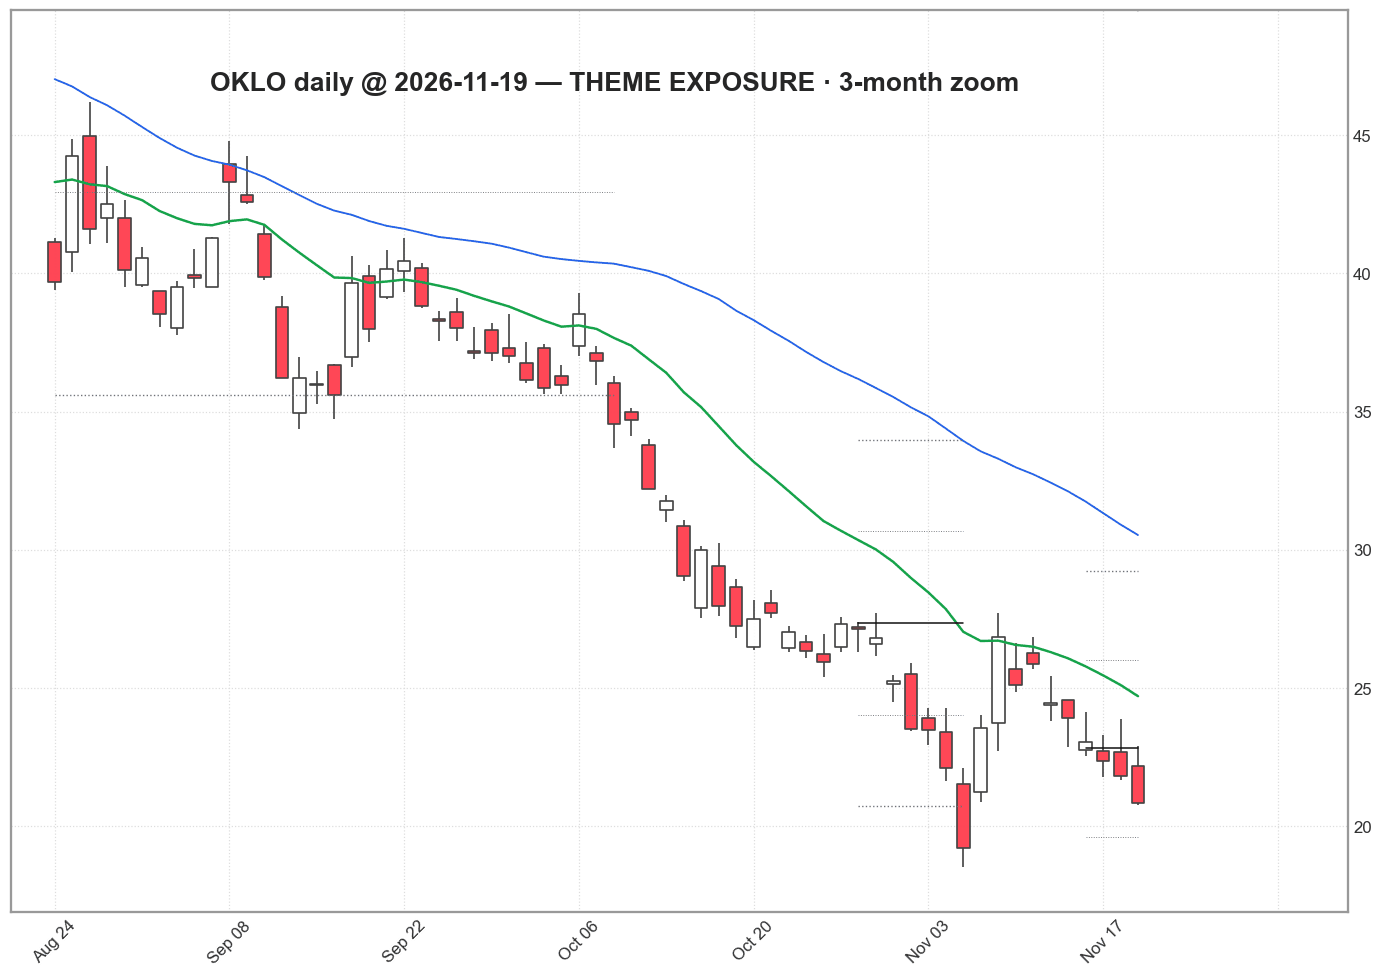
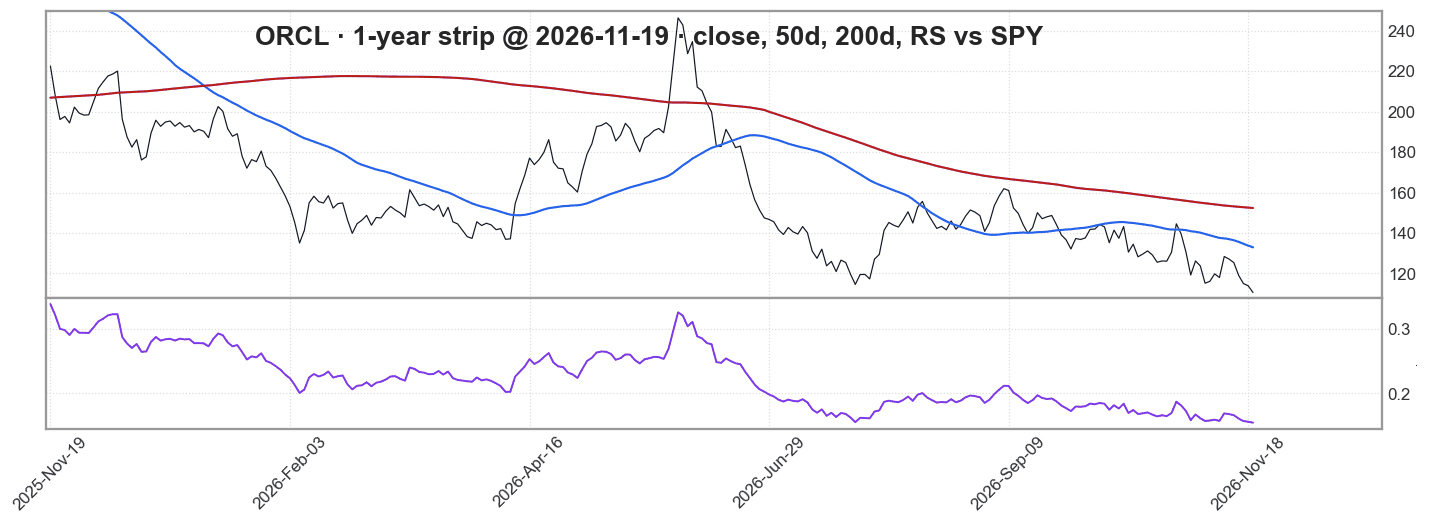
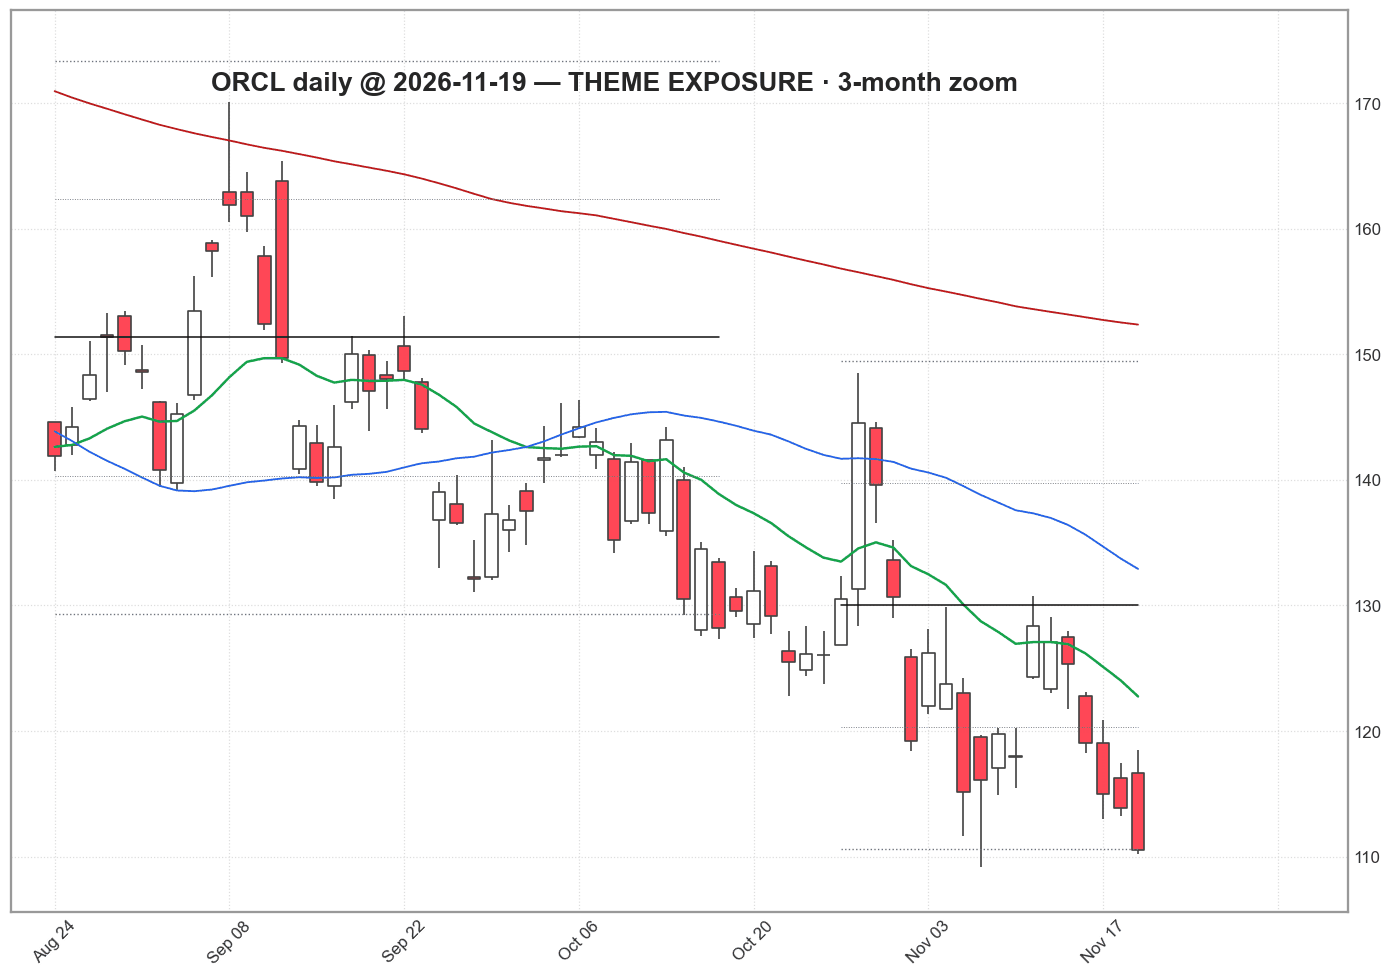
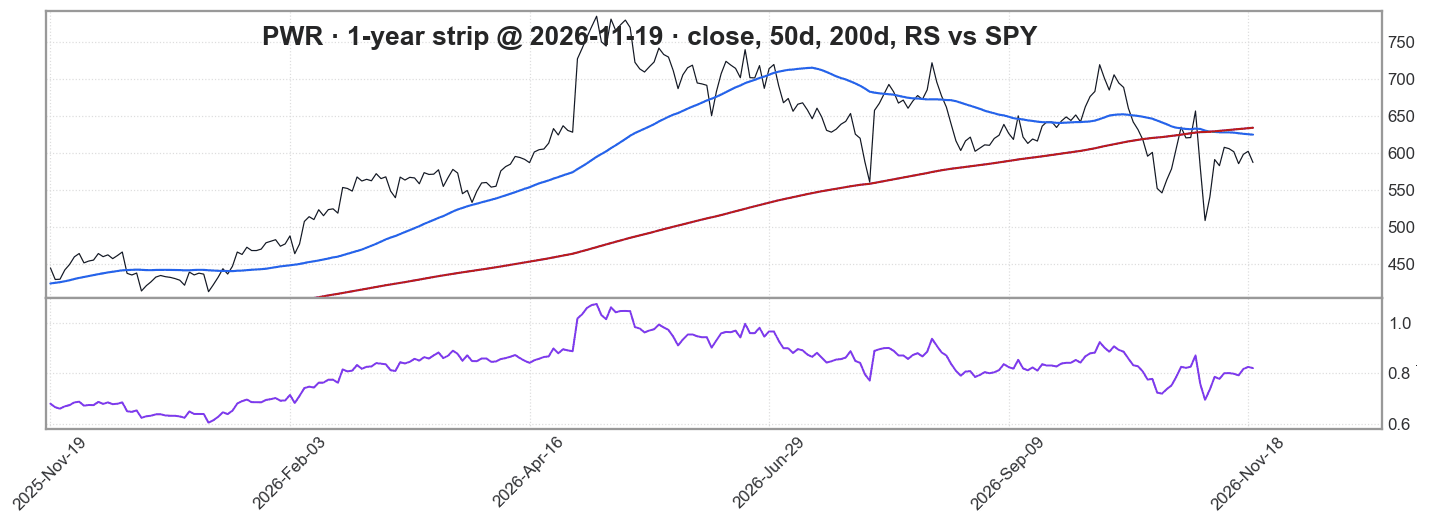
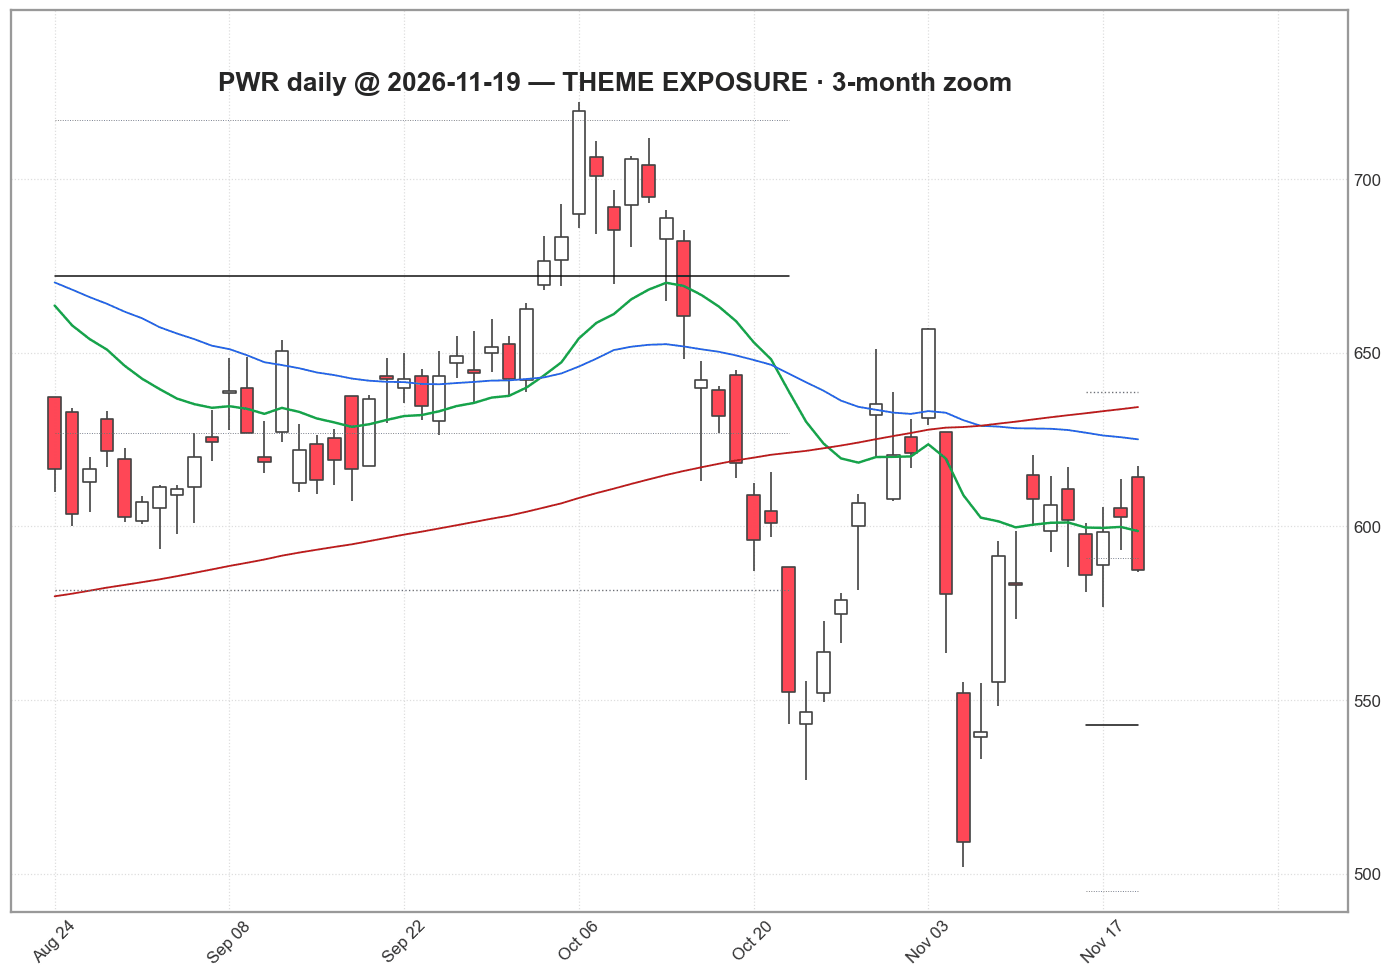
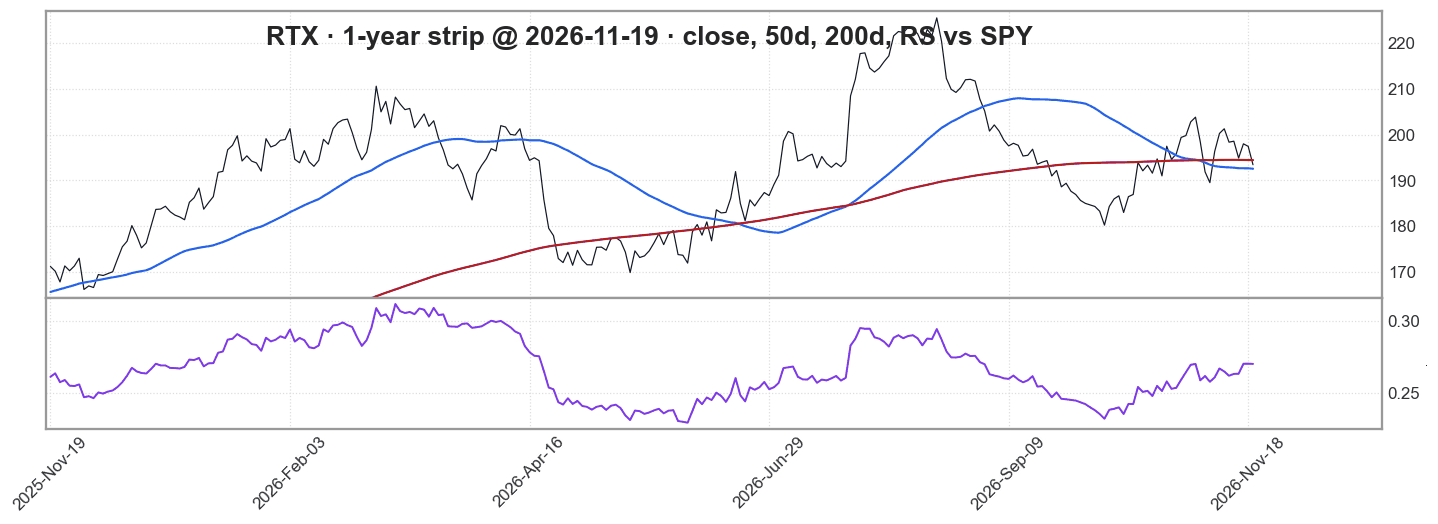
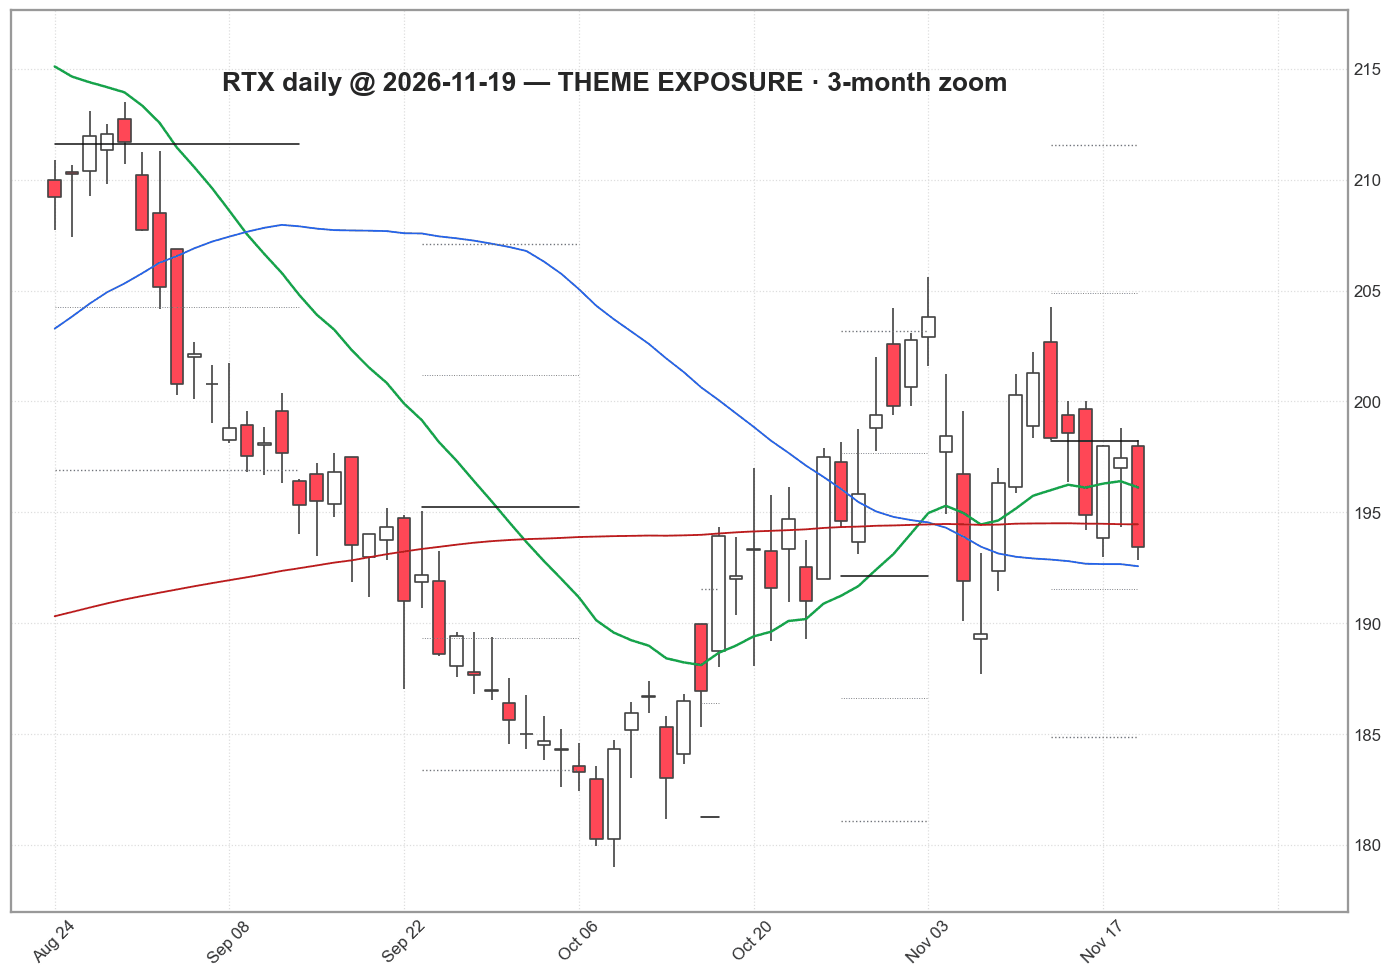
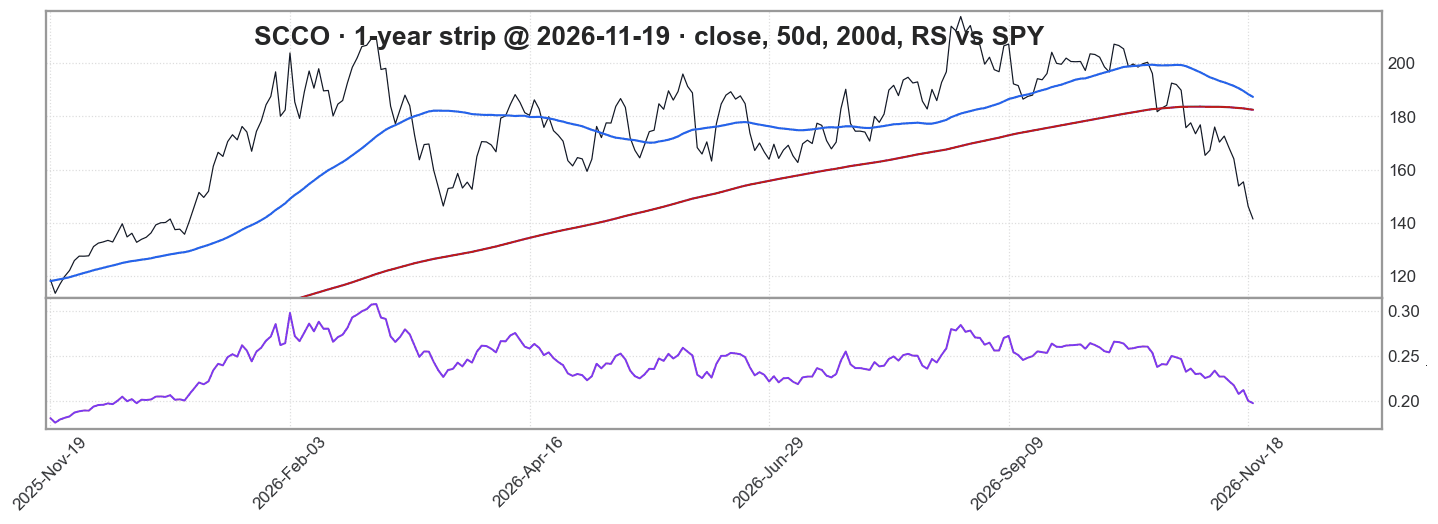
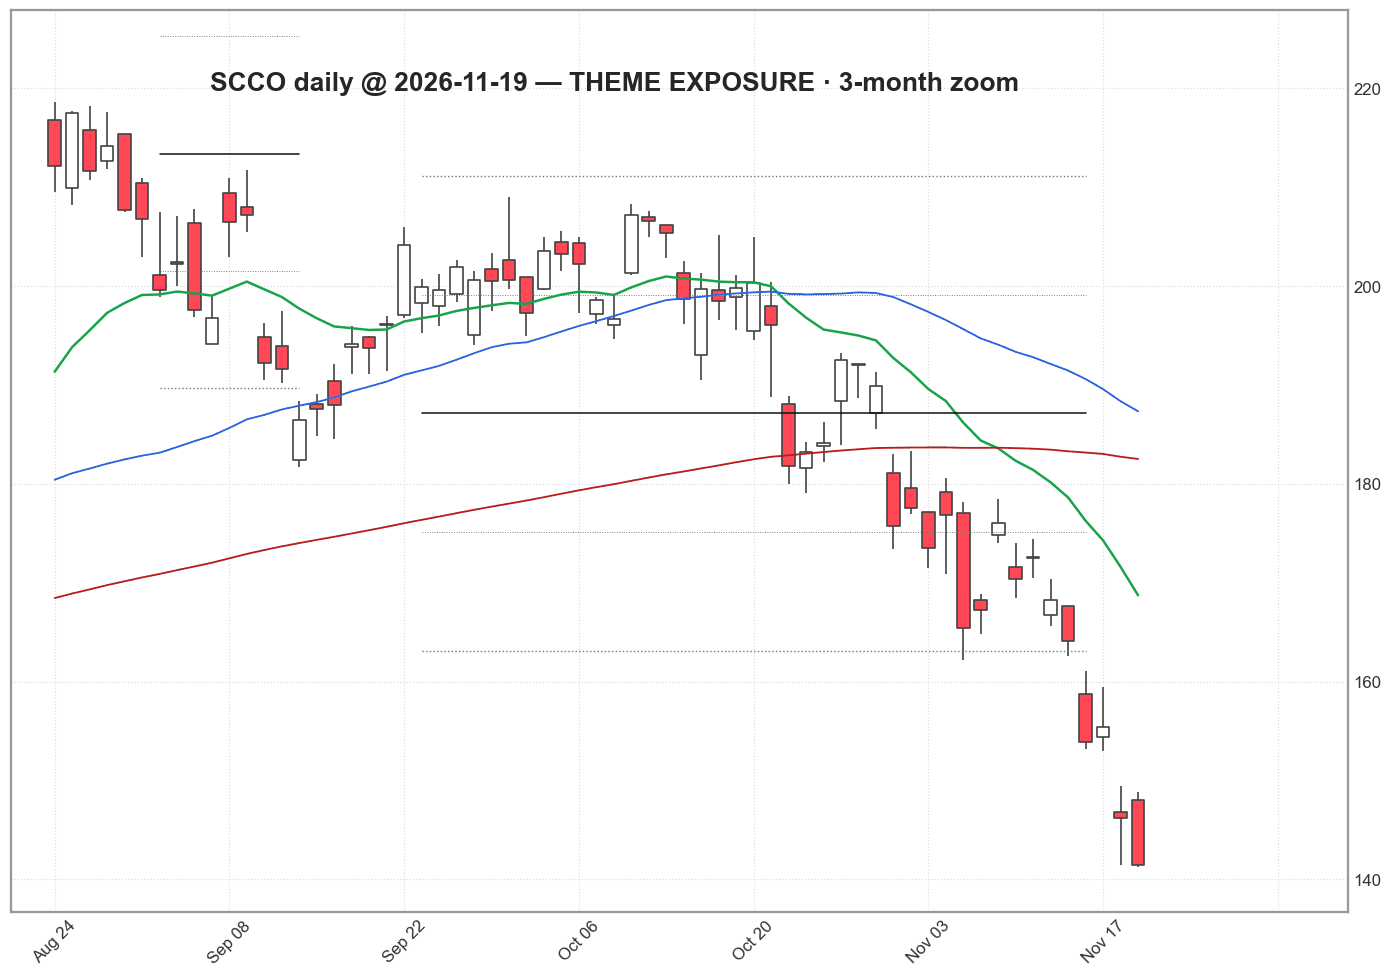
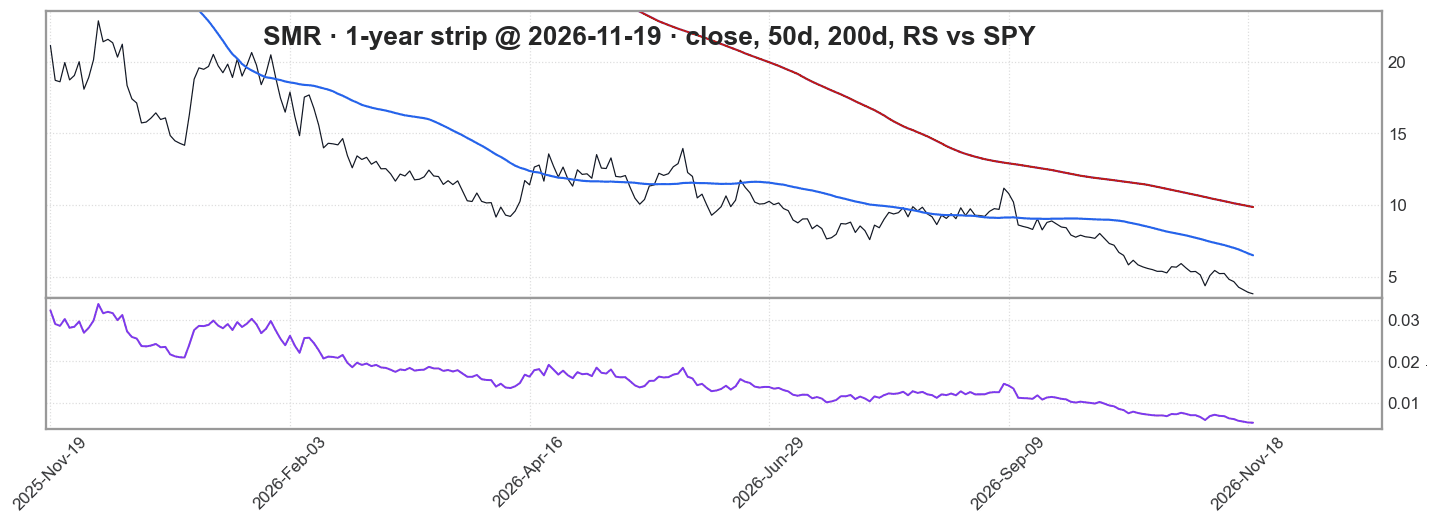
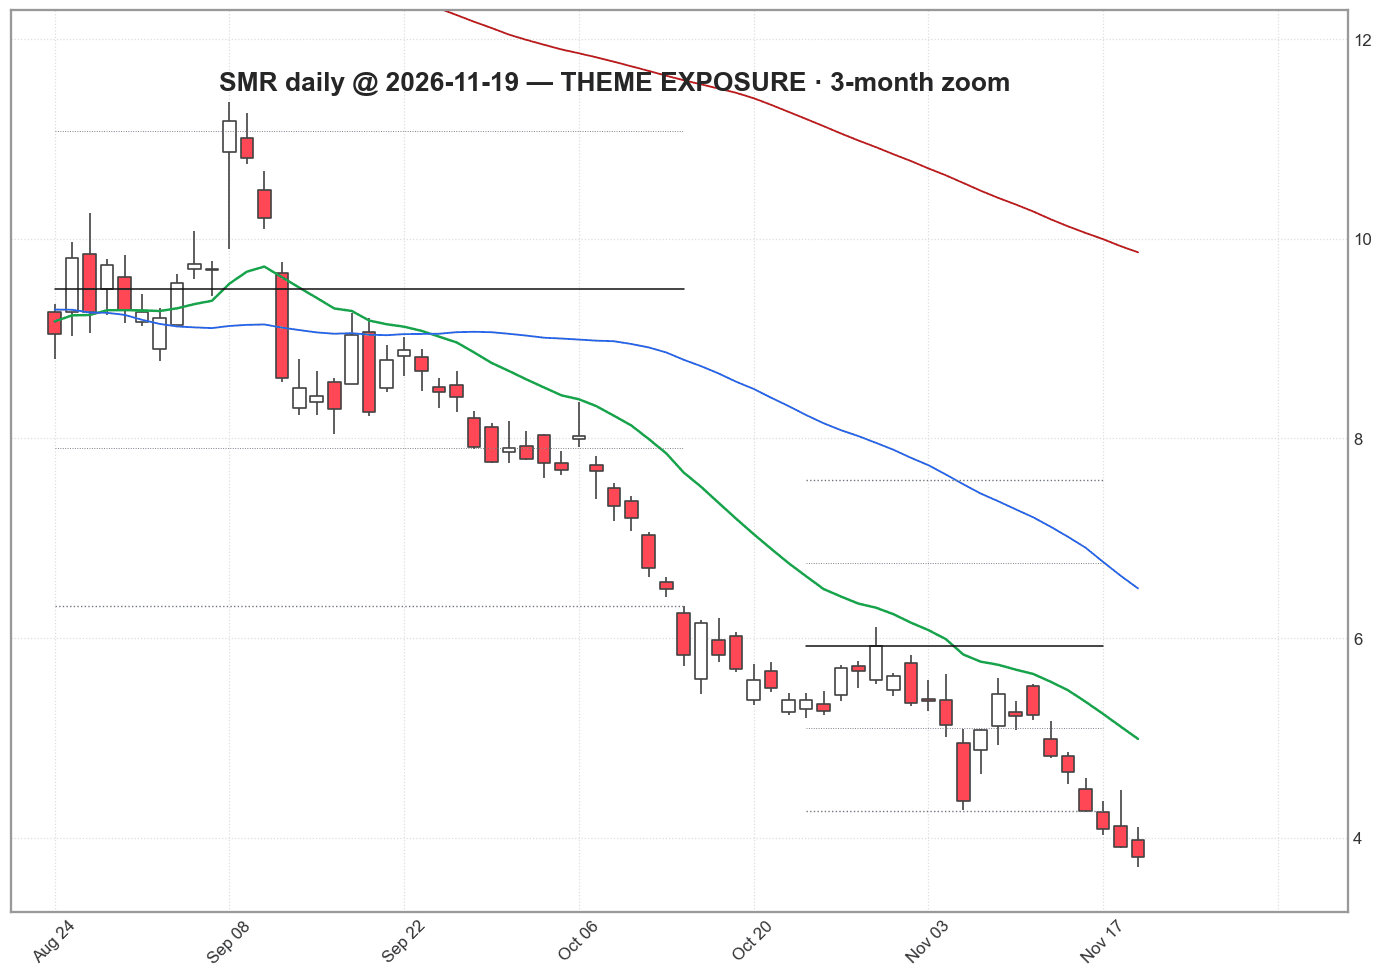
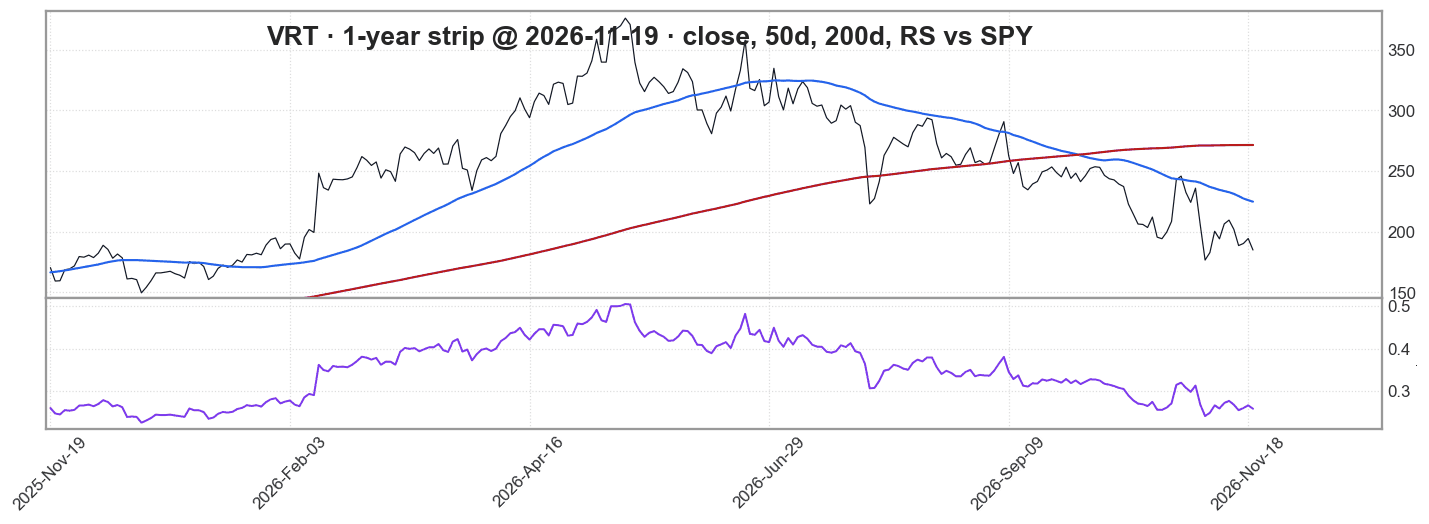
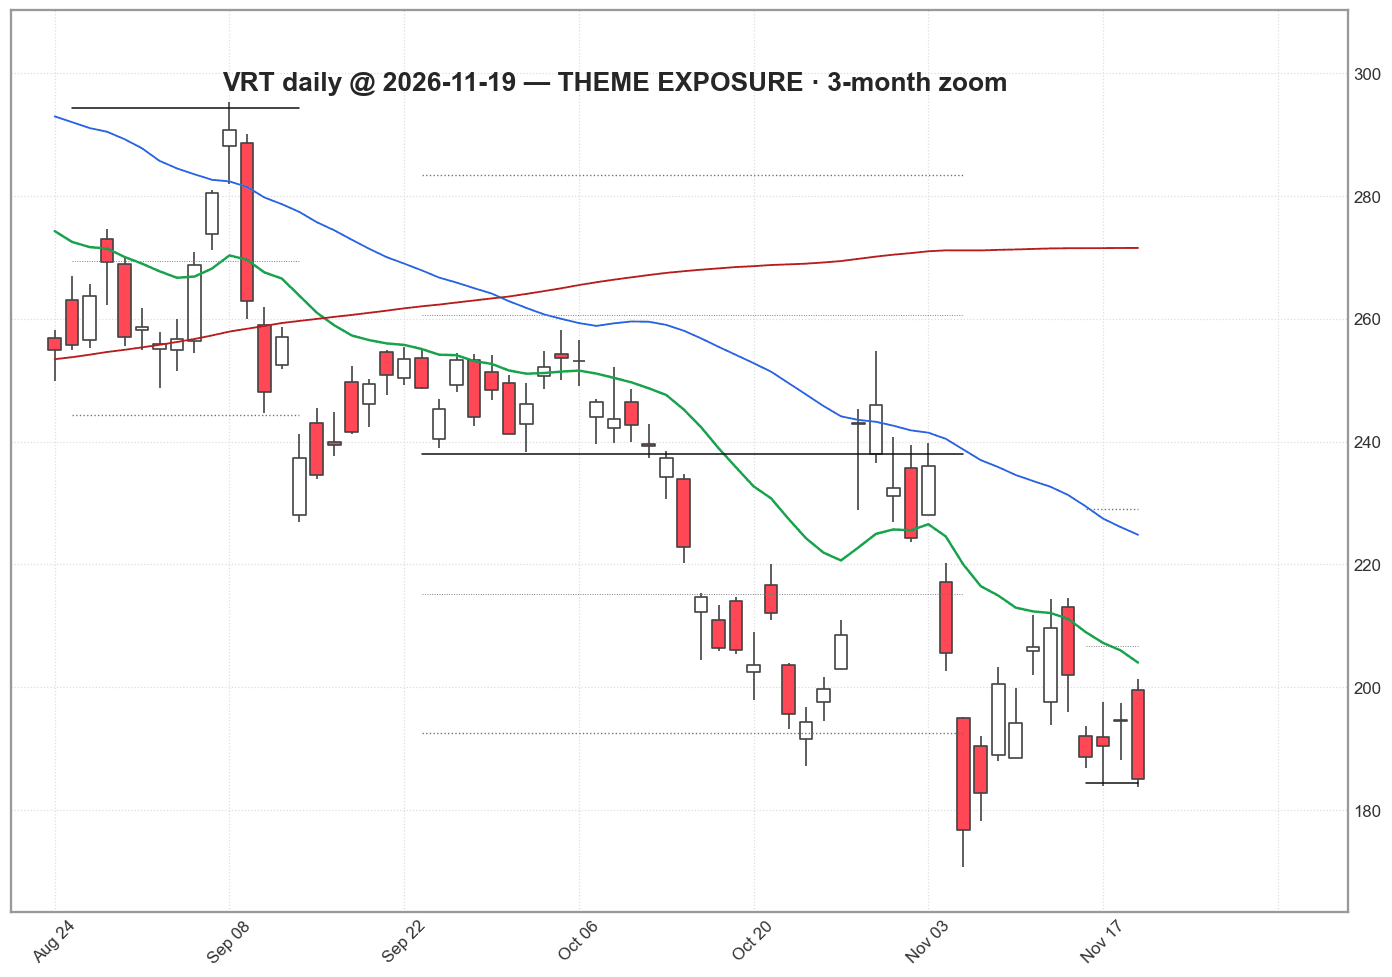
1-year strip · close (black), 50-day (blue), 200-day (dark red) · lower panel RS vs SPY (purple)3 months daily (main chart) · EMA20 (green), 50-day (blue), 200-day (dark red), VWAP bands · no entry or stop (theme view)
Themes
Hyperscaler Capex Supercycle
1M vs SPY
+5.9%
3M vs SPY
+6.2%
From 52-week high
-9.4%
Capex YoY
+140% (quarter 2026-09-30)
Next-year EPS, 90-day drift
+1.2%
Revision breadth, 30 days
+0.27 (28 up / 16 down)
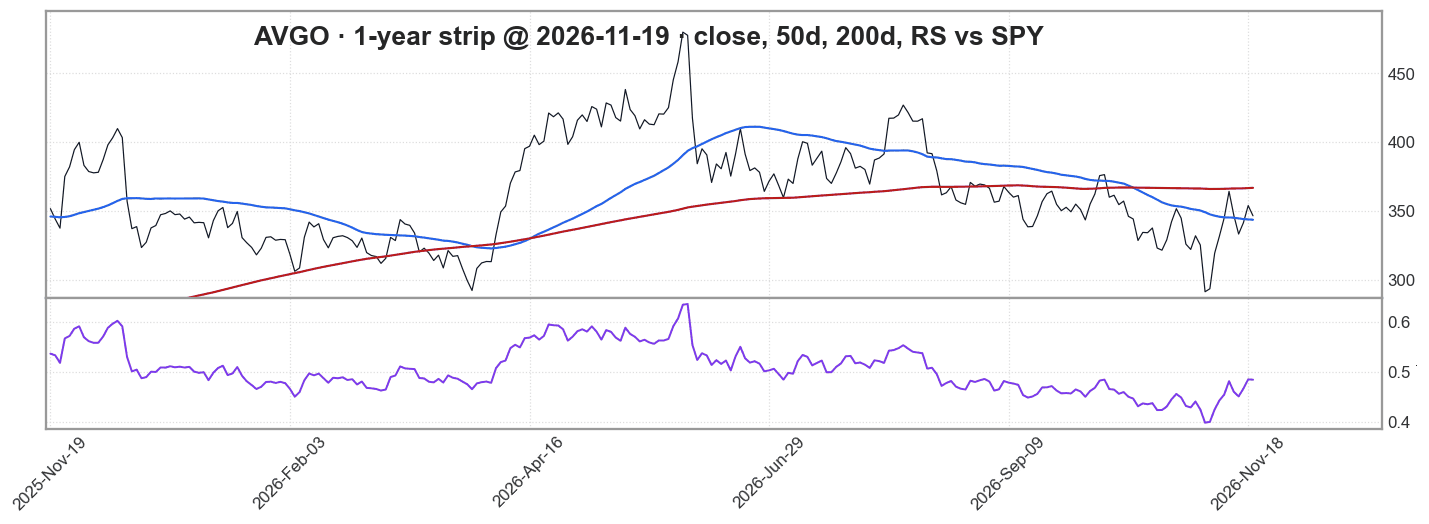
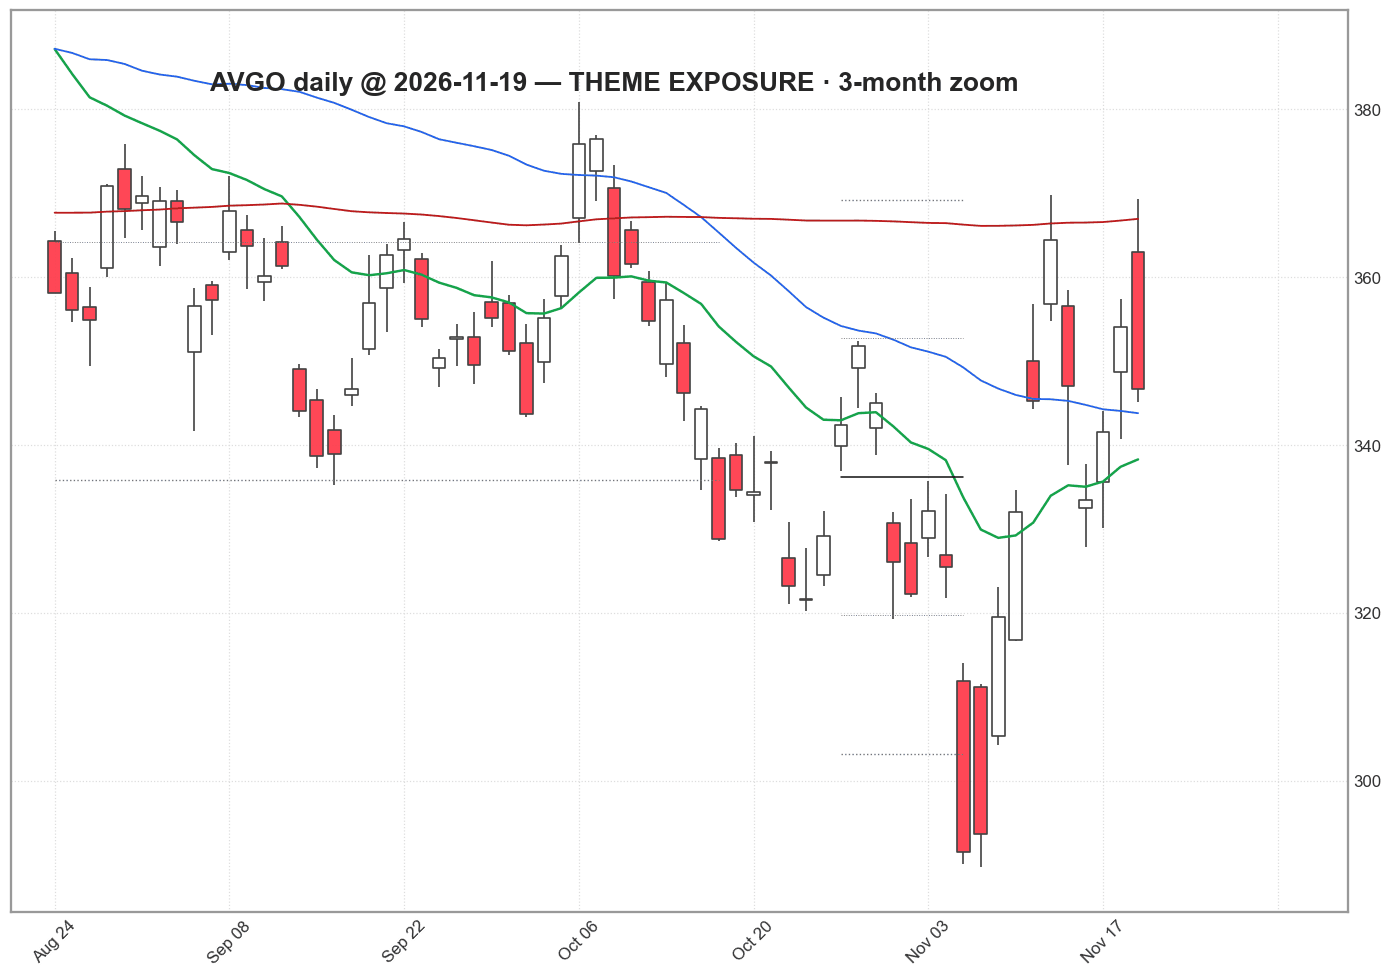
AVGO · Hyperscaler Capex Supercycle · 3M vs SPY +0.6%
price trend: strongPrices 2026-11-19
Named by the 2026-08-06 Grok read as exposed to Hyperscaler Capex Supercycle. Measured status this build: streams up. Theme exposure is a watchlist reason, not a signal. Source: Robinhood daily bars (Yahoo backup) through 2026-11-19; fundamentals via yfinance this build; theme membership from runs/THEME-2026-08-06.json
1-year strip · close (black), 50-day (blue), 200-day (dark red) · lower panel RS vs SPY (purple)3 months daily (main chart) · EMA20 (green), 50-day (blue), 200-day (dark red), VWAP bands · no entry or stop (theme view)
Themes
Hyperscaler Capex Supercycle
1M vs SPY
+10.8%
3M vs SPY
+0.6%
From 52-week high
-27.8%
Capex YoY
+275% (quarter 2026-07-31)
Next-year EPS, 90-day drift
-0.8%
Revision breadth, 30 days
+1.00 (2 up / 0 down)
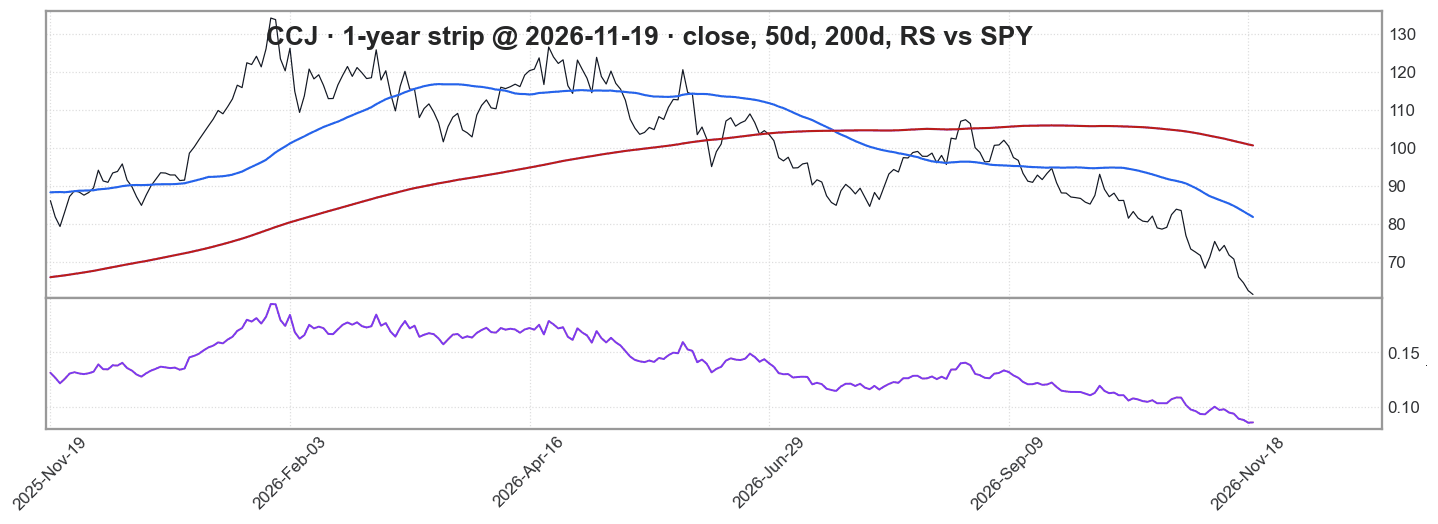
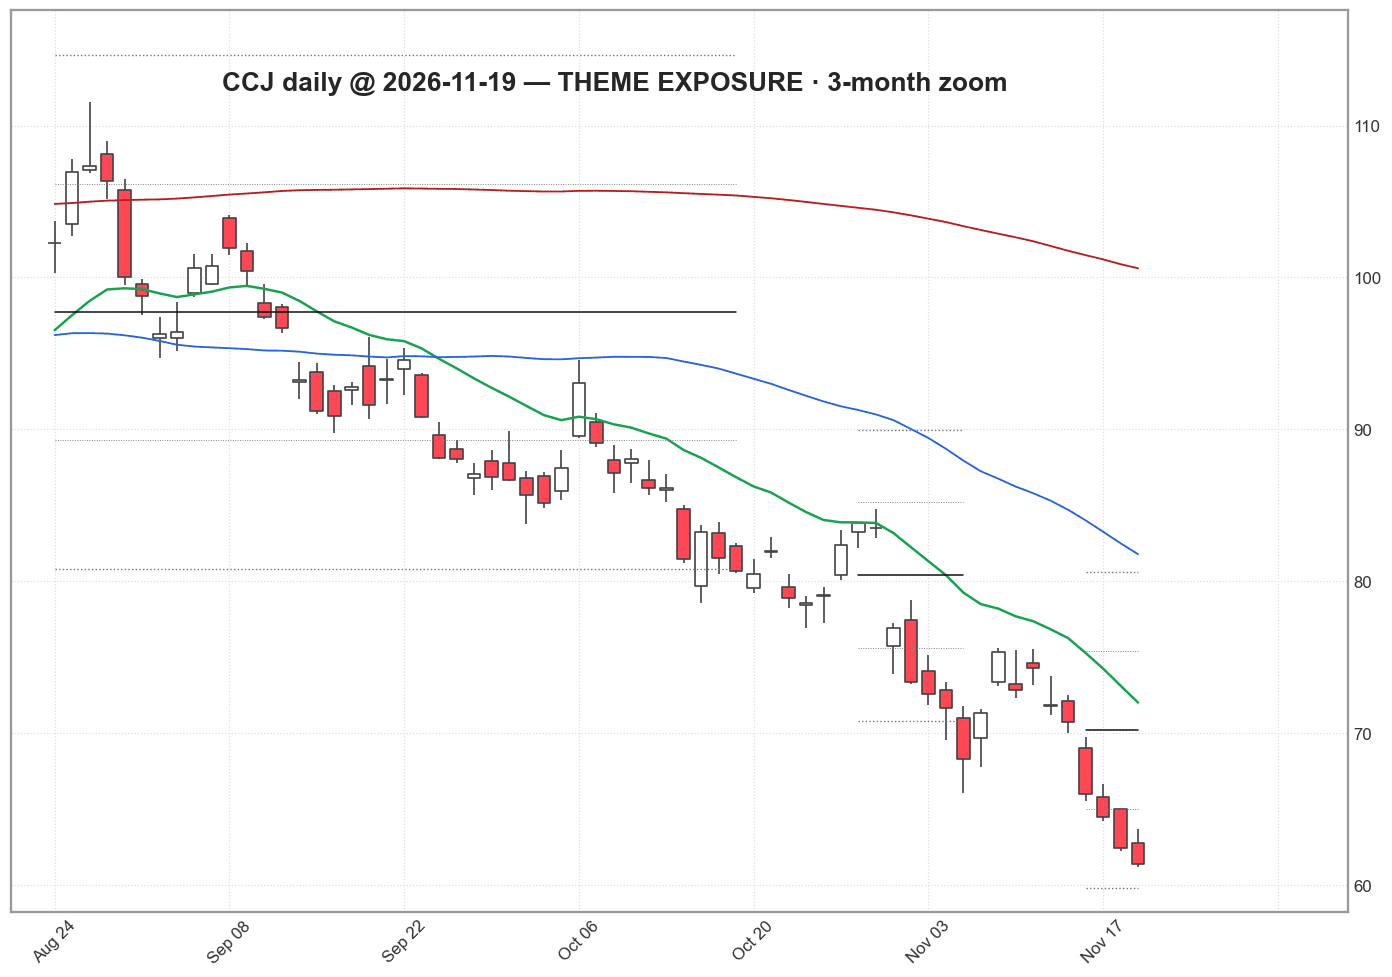
CCJ · Nuclear for AI · 3M vs SPY -36.1%
price trend: weakPrices 2026-11-19
Named by the 2026-08-06 Grok read as exposed to Nuclear for AI. Measured status this build: mixed. Theme exposure is a watchlist reason, not a signal. Source: Robinhood daily bars (Yahoo backup) through 2026-11-19; fundamentals via yfinance this build; theme membership from runs/THEME-2026-08-06.json
1-year strip · close (black), 50-day (blue), 200-day (dark red) · lower panel RS vs SPY (purple)3 months daily (main chart) · EMA20 (green), 50-day (blue), 200-day (dark red), VWAP bands · no entry or stop (theme view)
Themes
Nuclear for AI
1M vs SPY
-19.1%
3M vs SPY
-36.1%
From 52-week high
-54.2%
Capex YoY
+48% (quarter 2026-09-30)
Next-year EPS, 90-day drift
-7.8%
Revision breadth, 30 days
-0.50 (3 up / 9 down)
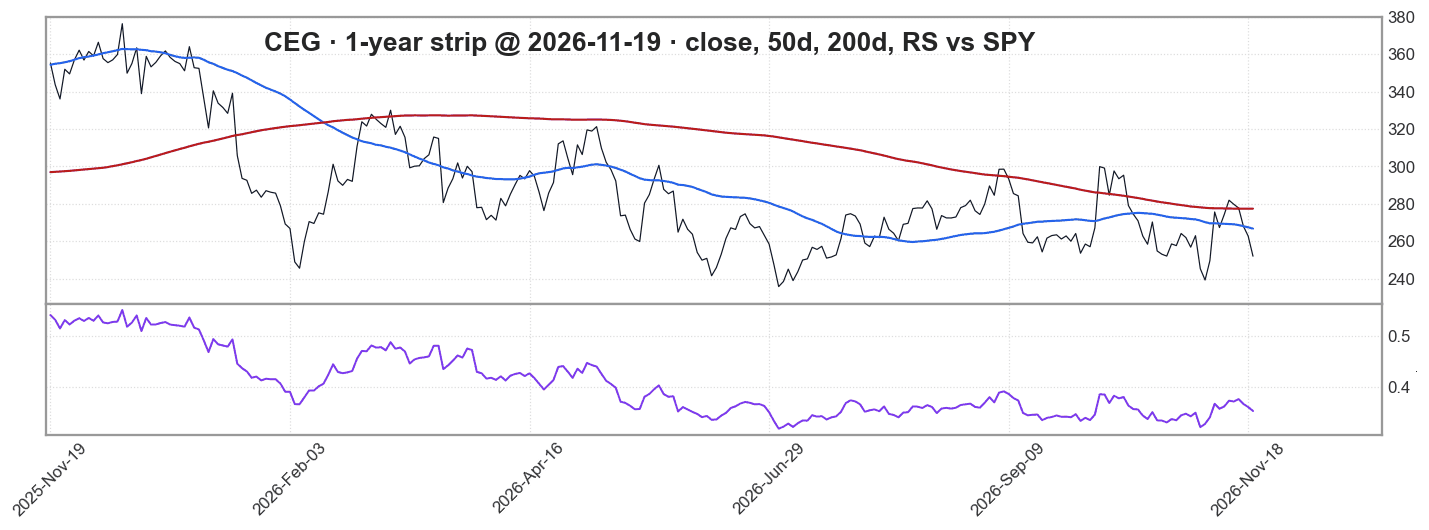
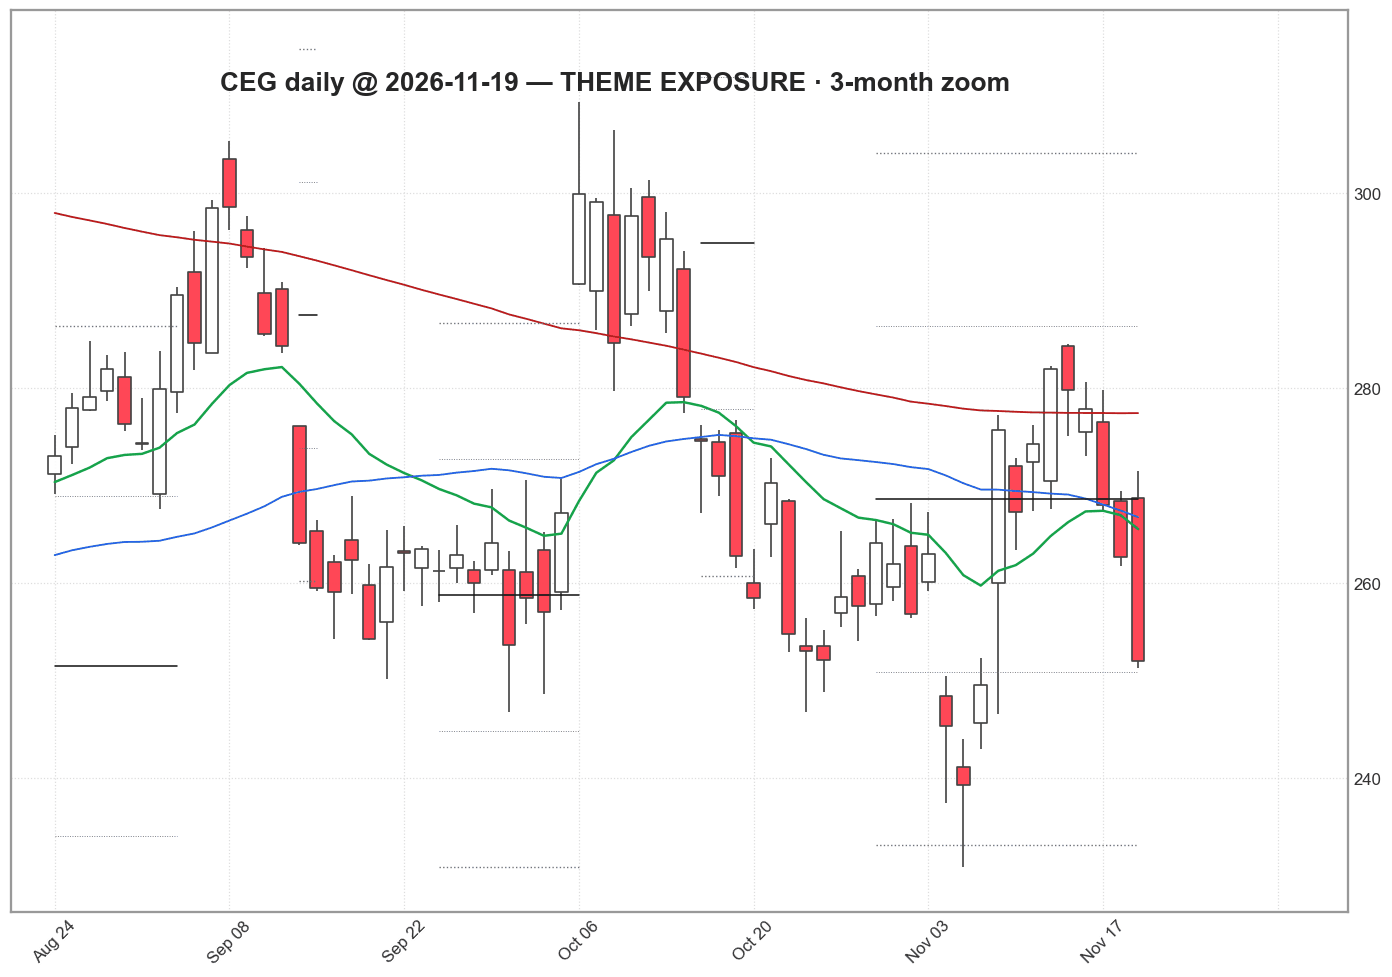
CEG · AI Power Bottleneck +1 · 3M vs SPY -1.3%
price trend: mixedPrices 2026-11-19
Named by the 2026-08-06 Grok read as exposed to AI Power Bottleneck and Nuclear for AI. Measured status this build: streams up. Theme exposure is a watchlist reason, not a signal. Source: Robinhood daily bars (Yahoo backup) through 2026-11-19; fundamentals via yfinance this build; theme membership from runs/THEME-2026-08-06.json
1-year strip · close (black), 50-day (blue), 200-day (dark red) · lower panel RS vs SPY (purple)3 months daily (main chart) · EMA20 (green), 50-day (blue), 200-day (dark red), VWAP bands · no entry or stop (theme view)
Themes
AI Power Bottleneck · Nuclear for AI
1M vs SPY
+0.7%
3M vs SPY
-1.3%
From 52-week high
-33.0%
Capex YoY
+141% (quarter 2026-09-30)
Next-year EPS, 90-day drift
+0.4%
Revision breadth, 30 days
+0.14 (4 up / 3 down)
ETN · AI Power Bottleneck +1 · 3M vs SPY -15.6%
price trend: weakPrices 2026-11-19
Named by the 2026-08-06 Grok read as exposed to AI Power Bottleneck and Grid Equipment Crunch. Measured status this build: streams up. Theme exposure is a watchlist reason, not a signal. Source: Robinhood daily bars (Yahoo backup) through 2026-11-19; fundamentals via yfinance this build; theme membership from runs/THEME-2026-08-06.json
1-year strip · close (black), 50-day (blue), 200-day (dark red) · lower panel RS vs SPY (purple)3 months daily (main chart) · EMA20 (green), 50-day (blue), 200-day (dark red), VWAP bands · no entry or stop (theme view)
Themes
AI Power Bottleneck · Grid Equipment Crunch
1M vs SPY
-9.1%
3M vs SPY
-15.6%
From 52-week high
-27.9%
Capex YoY
+54% (quarter 2026-09-30)
Next-year EPS, 90-day drift
+2.8%
Revision breadth, 30 days
+0.47 (11 up / 4 down)
FCX · Copper Electrification Scarcity · 3M vs SPY -31.5%
price trend: weakPrices 2026-11-19
Named by the 2026-08-06 Grok read as exposed to Copper Electrification Scarcity. Measured status this build: streams up. Theme exposure is a watchlist reason, not a signal. Source: Robinhood daily bars (Yahoo backup) through 2026-11-19; fundamentals via yfinance this build; theme membership from runs/THEME-2026-08-06.json
1-year strip · close (black), 50-day (blue), 200-day (dark red) · lower panel RS vs SPY (purple)3 months daily (main chart) · EMA20 (green), 50-day (blue), 200-day (dark red), VWAP bands · no entry or stop (theme view)
Themes
Copper Electrification Scarcity
1M vs SPY
-23.0%
3M vs SPY
-31.5%
From 52-week high
-38.4%
Capex YoY
+10% (quarter 2026-09-30)
Next-year EPS, 90-day drift
+2.4%
Revision breadth, 30 days
+0.20 (9 up / 6 down)
GD · NATO Defense Re-armament · 3M vs SPY -3.1%
price trend: mixedPrices 2026-11-19
Named by the 2026-08-06 Grok read as exposed to NATO Defense Re-armament. Measured status this build: streams up. Theme exposure is a watchlist reason, not a signal. Source: Robinhood daily bars (Yahoo backup) through 2026-11-19; fundamentals via yfinance this build; theme membership from runs/THEME-2026-08-06.json
1-year strip · close (black), 50-day (blue), 200-day (dark red) · lower panel RS vs SPY (purple)3 months daily (main chart) · EMA20 (green), 50-day (blue), 200-day (dark red), VWAP bands · no entry or stop (theme view)
Themes
NATO Defense Re-armament
1M vs SPY
+8.8%
3M vs SPY
-3.1%
From 52-week high
-11.9%
Capex YoY
+127% (quarter 2026-09-30)
Next-year EPS, 90-day drift
+2.2%
Revision breadth, 30 days
+0.88 (16 up / 1 down)
GEV · AI Power Bottleneck +1 · 3M vs SPY -15.6%
price trend: weakPrices 2026-11-19
Named by the 2026-08-06 Grok read as exposed to AI Power Bottleneck and Grid Equipment Crunch. Measured status this build: streams up. Theme exposure is a watchlist reason, not a signal. Source: Robinhood daily bars (Yahoo backup) through 2026-11-19; fundamentals via yfinance this build; theme membership from runs/THEME-2026-08-06.json
1-year strip · close (black), 50-day (blue), 200-day (dark red) · lower panel RS vs SPY (purple)3 months daily (main chart) · EMA20 (green), 50-day (blue), 200-day (dark red), VWAP bands · no entry or stop (theme view)
Themes
AI Power Bottleneck · Grid Equipment Crunch
1M vs SPY
-11.7%
3M vs SPY
-15.6%
From 52-week high
-35.6%
Capex YoY
+162% (quarter 2026-09-30)
Next-year EPS, 90-day drift
+5.5%
Revision breadth, 30 days
+0.65 (19 up / 4 down)
HUBB · Grid Equipment Crunch · 3M vs SPY -4.6%
price trend: weakPrices 2026-11-19
Named by the 2026-08-06 Grok read as exposed to Grid Equipment Crunch. Measured status this build: streams up. Theme exposure is a watchlist reason, not a signal. Source: Robinhood daily bars (Yahoo backup) through 2026-11-19; fundamentals via yfinance this build; theme membership from runs/THEME-2026-08-06.json
1-year strip · close (black), 50-day (blue), 200-day (dark red) · lower panel RS vs SPY (purple)3 months daily (main chart) · EMA20 (green), 50-day (blue), 200-day (dark red), VWAP bands · no entry or stop (theme view)
Themes
Grid Equipment Crunch
1M vs SPY
-1.9%
3M vs SPY
-4.6%
From 52-week high
-24.5%
Capex YoY
+38% (quarter 2026-09-30)
Next-year EPS, 90-day drift
+0.8%
Revision breadth, 30 days
+0.00 (6 up / 6 down)
LMT · NATO Defense Re-armament · 3M vs SPY +8.9%
price trend: strongPrices 2026-11-19
Named by the 2026-08-06 Grok read as exposed to NATO Defense Re-armament. Measured status this build: streams up. Theme exposure is a watchlist reason, not a signal. Source: Robinhood daily bars (Yahoo backup) through 2026-11-19; fundamentals via yfinance this build; theme membership from runs/THEME-2026-08-06.json
1-year strip · close (black), 50-day (blue), 200-day (dark red) · lower panel RS vs SPY (purple)3 months daily (main chart) · EMA20 (green), 50-day (blue), 200-day (dark red), VWAP bands · no entry or stop (theme view)
Themes
NATO Defense Re-armament
1M vs SPY
+12.0%
3M vs SPY
+8.9%
From 52-week high
-14.4%
Capex YoY
+15% (quarter 2026-09-30)
Next-year EPS, 90-day drift
+1.9%
Revision breadth, 30 days
+0.89 (17 up / 1 down)
MSFT · Hyperscaler Capex Supercycle · 3M vs SPY +10.0%
price trend: mixedPrices 2026-11-19
Named by the 2026-08-06 Grok read as exposed to Hyperscaler Capex Supercycle. Measured status this build: streams up. Theme exposure is a watchlist reason, not a signal. Source: Robinhood daily bars (Yahoo backup) through 2026-11-19; fundamentals via yfinance this build; theme membership from runs/THEME-2026-08-06.json
1-year strip · close (black), 50-day (blue), 200-day (dark red) · lower panel RS vs SPY (purple)3 months daily (main chart) · EMA20 (green), 50-day (blue), 200-day (dark red), VWAP bands · no entry or stop (theme view)
Themes
Hyperscaler Capex Supercycle
1M vs SPY
+1.0%
3M vs SPY
+10.0%
From 52-week high
-10.3%
Capex YoY
+103% (quarter 2026-09-30)
Next-year EPS, 90-day drift
+2.7%
Revision breadth, 30 days
+0.79 (25 up / 3 down)
NOC · NATO Defense Re-armament · 3M vs SPY +5.5%
price trend: strongPrices 2026-11-19
Named by the 2026-08-06 Grok read as exposed to NATO Defense Re-armament. Measured status this build: streams down. Theme exposure is a watchlist reason, not a signal. Source: Robinhood daily bars (Yahoo backup) through 2026-11-19; fundamentals via yfinance this build; theme membership from runs/THEME-2026-08-06.json
1-year strip · close (black), 50-day (blue), 200-day (dark red) · lower panel RS vs SPY (purple)3 months daily (main chart) · EMA20 (green), 50-day (blue), 200-day (dark red), VWAP bands · no entry or stop (theme view)
Themes
NATO Defense Re-armament
1M vs SPY
+8.6%
3M vs SPY
+5.5%
From 52-week high
-28.8%
Capex YoY
+2% (quarter 2026-09-30)
Next-year EPS, 90-day drift
-1.6%
Revision breadth, 30 days
-0.30 (7 up / 13 down)
NVDA · Hyperscaler Capex Supercycle · 3M vs SPY -27.4%
price trend: weakPrices 2026-11-19
Named by the 2026-08-06 Grok read as exposed to Hyperscaler Capex Supercycle. Measured status this build: streams up. Theme exposure is a watchlist reason, not a signal. Source: Robinhood daily bars (Yahoo backup) through 2026-11-19; fundamentals via yfinance this build; theme membership from runs/THEME-2026-08-06.json
1-year strip · close (black), 50-day (blue), 200-day (dark red) · lower panel RS vs SPY (purple)3 months daily (main chart) · EMA20 (green), 50-day (blue), 200-day (dark red), VWAP bands · no entry or stop (theme view)
Themes
Hyperscaler Capex Supercycle
1M vs SPY
-29.0%
3M vs SPY
-27.4%
From 52-week high
-39.0%
Capex YoY
+41% (quarter 2026-07-31)
Next-year EPS, 90-day drift
+27.7%
Revision breadth, 30 days
+1.00 (7 up / 0 down)
OKLO · Nuclear for AI · 3M vs SPY -47.2%
price trend: weakPrices 2026-11-19
Named by the 2026-08-06 Grok read as exposed to Nuclear for AI. Measured status this build: streams up. Theme exposure is a watchlist reason, not a signal. Source: Robinhood daily bars (Yahoo backup) through 2026-11-19; fundamentals via yfinance this build; theme membership from runs/THEME-2026-08-06.json
1-year strip · close (black), 50-day (blue), 200-day (dark red) · lower panel RS vs SPY (purple)3 months daily (main chart) · EMA20 (green), 50-day (blue), 200-day (dark red), VWAP bands · no entry or stop (theme view)
Themes
Nuclear for AI
1M vs SPY
-18.8%
3M vs SPY
-47.2%
From 52-week high
-81.3%
Capex YoY
+2959% (quarter 2026-09-30)
Next-year EPS, 90-day drift
+16.6%
Revision breadth, 30 days
+0.33 (2 up / 1 down)
ORCL · Hyperscaler Capex Supercycle · 3M vs SPY -19.2%
price trend: weakPrices 2026-11-19
Named by the 2026-08-06 Grok read as exposed to Hyperscaler Capex Supercycle. Measured status this build: streams up. Theme exposure is a watchlist reason, not a signal. Source: Robinhood daily bars (Yahoo backup) through 2026-11-19; fundamentals via yfinance this build; theme membership from runs/THEME-2026-08-06.json
1-year strip · close (black), 50-day (blue), 200-day (dark red) · lower panel RS vs SPY (purple)3 months daily (main chart) · EMA20 (green), 50-day (blue), 200-day (dark red), VWAP bands · no entry or stop (theme view)
Themes
Hyperscaler Capex Supercycle
1M vs SPY
-7.5%
3M vs SPY
-19.2%
From 52-week high
-55.1%
Capex YoY
+235% (quarter 2026-08-31)
Next-year EPS, 90-day drift
+1.3%
Revision breadth, 30 days
+0.07 (8 up / 7 down)
PWR · AI Power Bottleneck +1 · 3M vs SPY -1.9%
price trend: mixedPrices 2026-11-19
Named by the 2026-08-06 Grok read as exposed to AI Power Bottleneck and Grid Equipment Crunch. Measured status this build: streams up. Theme exposure is a watchlist reason, not a signal. Source: Robinhood daily bars (Yahoo backup) through 2026-11-19; fundamentals via yfinance this build; theme membership from runs/THEME-2026-08-06.json
1-year strip · close (black), 50-day (blue), 200-day (dark red) · lower panel RS vs SPY (purple)3 months daily (main chart) · EMA20 (green), 50-day (blue), 200-day (dark red), VWAP bands · no entry or stop (theme view)
Themes
AI Power Bottleneck · Grid Equipment Crunch
1M vs SPY
+5.5%
3M vs SPY
-1.9%
From 52-week high
-25.2%
Capex YoY
+88% (quarter 2026-09-30)
Next-year EPS, 90-day drift
+10.6%
Revision breadth, 30 days
+1.00 (25 up / 0 down)
RTX · NATO Defense Re-armament · 3M vs SPY -1.7%
price trend: mixedPrices 2026-11-19
Named by the 2026-08-06 Grok read as exposed to NATO Defense Re-armament. Measured status this build: streams up. Theme exposure is a watchlist reason, not a signal. Source: Robinhood daily bars (Yahoo backup) through 2026-11-19; fundamentals via yfinance this build; theme membership from runs/THEME-2026-08-06.json
1-year strip · close (black), 50-day (blue), 200-day (dark red) · lower panel RS vs SPY (purple)3 months daily (main chart) · EMA20 (green), 50-day (blue), 200-day (dark red), VWAP bands · no entry or stop (theme view)
Themes
NATO Defense Re-armament
1M vs SPY
+9.0%
3M vs SPY
-1.7%
From 52-week high
-14.2%
Capex YoY
+12% (quarter 2026-09-30)
Next-year EPS, 90-day drift
+3.0%
Revision breadth, 30 days
+0.90 (19 up / 1 down)
SCCO · Copper Electrification Scarcity · 3M vs SPY -29.4%
price trend: weakPrices 2026-11-19
Named by the 2026-08-06 Grok read as exposed to Copper Electrification Scarcity. Measured status this build: streams up. Theme exposure is a watchlist reason, not a signal. Source: Robinhood daily bars (Yahoo backup) through 2026-11-19; fundamentals via yfinance this build; theme membership from runs/THEME-2026-08-06.json
1-year strip · close (black), 50-day (blue), 200-day (dark red) · lower panel RS vs SPY (purple)3 months daily (main chart) · EMA20 (green), 50-day (blue), 200-day (dark red), VWAP bands · no entry or stop (theme view)
Themes
Copper Electrification Scarcity
1M vs SPY
-22.1%
3M vs SPY
-29.4%
From 52-week high
-35.0%
Capex YoY
+79% (quarter 2026-06-30)
Next-year EPS, 90-day drift
+7.1%
Revision breadth, 30 days
+0.23 (8 up / 5 down)
SMR · Nuclear for AI · 3M vs SPY -56.8%
price trend: weakPrices 2026-11-19
Named by the 2026-08-06 Grok read as exposed to Nuclear for AI. Measured status this build: streams up. Theme exposure is a watchlist reason, not a signal. Source: Robinhood daily bars (Yahoo backup) through 2026-11-19; fundamentals via yfinance this build; theme membership from runs/THEME-2026-08-06.json
1-year strip · close (black), 50-day (blue), 200-day (dark red) · lower panel RS vs SPY (purple)3 months daily (main chart) · EMA20 (green), 50-day (blue), 200-day (dark red), VWAP bands · no entry or stop (theme view)
Themes
Nuclear for AI
1M vs SPY
-25.2%
3M vs SPY
-56.8%
From 52-week high
-83.3%
Capex YoY
+40% (quarter 2026-09-30)
Next-year EPS, 90-day drift
-0.8%
Revision breadth, 30 days
+0.60 (4 up / 1 down)
VRT · AI Power Bottleneck · 3M vs SPY -24.6%
price trend: weakPrices 2026-11-19
Named by the 2026-08-06 Grok read as exposed to AI Power Bottleneck. Measured status this build: streams up. Theme exposure is a watchlist reason, not a signal. Source: Robinhood daily bars (Yahoo backup) through 2026-11-19; fundamentals via yfinance this build; theme membership from runs/THEME-2026-08-06.json
1-year strip · close (black), 50-day (blue), 200-day (dark red) · lower panel RS vs SPY (purple)3 months daily (main chart) · EMA20 (green), 50-day (blue), 200-day (dark red), VWAP bands · no entry or stop (theme view)
Themes
AI Power Bottleneck
1M vs SPY
-5.8%
3M vs SPY
-24.6%
From 52-week high
-50.8%
Capex YoY
+204% (quarter 2026-09-30)
Next-year EPS, 90-day drift
+8.5%
Revision breadth, 30 days
+1.00 (27 up / 0 down)
VST · AI Power Bottleneck +1 · 3M vs SPY -2.6%
price trend: weakPrices 2026-11-19
Named by the 2026-08-06 Grok read as exposed to AI Power Bottleneck and Nuclear for AI. Measured status this build: mixed. Theme exposure is a watchlist reason, not a signal. Source: Robinhood daily bars (Yahoo backup) through 2026-11-19; fundamentals via yfinance this build; theme membership from runs/THEME-2026-08-06.json
1-year strip · close (black), 50-day (blue), 200-day (dark red) · lower panel RS vs SPY (purple)3 months daily (main chart) · EMA20 (green), 50-day (blue), 200-day (dark red), VWAP bands · no entry or stop (theme view)
Themes
AI Power Bottleneck · Nuclear for AI
1M vs SPY
-14.1%
3M vs SPY
-2.6%
From 52-week high
-30.8%
Capex YoY
+63% (quarter 2026-09-30)
Next-year EPS, 90-day drift
-3.9%
Revision breadth, 30 days
+1.00 (1 up / 0 down)
Price-trend badge: strong when the name beat the S&P 500 over both the last month and the last 3 months and closed above its 50-day average; weak when it trailed over both and closed below its 50-day average; otherwise mixed. This is not a service long or short.